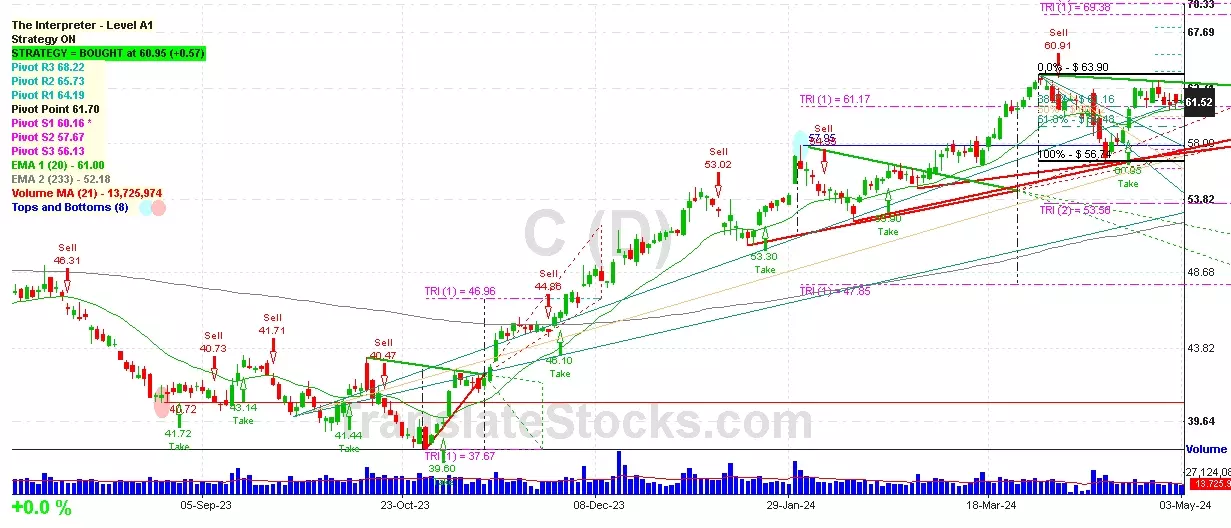
Hey Friend, I'm analysing CITIGROUP INC (C), and it is between the Support of $ 61.17 (Triangle Projection Level 1) and the Resistance of $ 61.70 (Pivot). The stock is also approaching the line of Pivot at $ 61.70, and if it goes above this line it could reach the next Resistance of 0% of Fibonacci at $ 63.90.

| Date | Price $ | Result % | Candle Name | Side |
|---|---|---|---|---|
| 001 09 Apr 2024 | Sell Price: 61.66 | Profit: Open Day1 ($ 60.52) | Engulfing | Sell |
| 002 15 Mar 2024 | Buy Price: 57.61 | Profit: Open Day1 ($ 57.85) | Piercing Line | Buy |
| 003 02 Jan 2024 | Buy Price: 53.04 | Profit: Open Day1 ($ 53.25) | Engulfing | Buy |
| 004 08 Aug 2023 | Sell Price: 45.16 | Profit: Open Day1 ($ 45.02) | Abandoned Baby | Sell |
| 005 24 Jul 2023 | Buy Price: 47.66 | Loss: Close Day2 ($ 47.50) | Engulfing | Buy |
| 006 29 Jun 2023 | Buy Price: 46.29 | Profit: Open Day1 ($ 46.78) | Piercing Line | Buy |
| 007 26 May 2023 | Buy Price: 44.60 | Profit: Open Day1 ($ 44.73) | Abandoned Baby | Buy |
| 008 26 May 2023 | Buy Price: 44.63 | Profit: Open Day1 ($ 44.73) | Engulfing | Buy |
| 009One Year Average | Both Sides Result for 8 Signals |
Profit: $ 2.28 ($ 0.29 / Signal) |
All of Them | Buy + Sell |
| Simple Moving Averages (SMA) Period | Value $ | Signal | Exponential Moving Averages (EMA) Period | Value $ | Signal | |
|---|---|---|---|---|---|---|
| 2 | 61.52 | SELL | 2 | 61.51 | BUY | |
| 3 | 61.47 | BUY | 3 | 61.53 | SELL | |
| 5 | 61.60 | SELL | 5 | 61.57 | SELL | |
| 8 | 61.86 | SELL | 8 | 61.49 | BUY | |
| 13 | 61.09 | BUY | 13 | 61.28 | BUY | |
| 21 | 60.73 | BUY | 21 | 60.96 | BUY | |
| 34 | 60.96 | BUY | 34 | 60.31 | BUY | |
| 55 | 59.18 | BUY | 55 | 59.01 | BUY | |
| 90 | 56.94 | BUY | 90 | 56.82 | BUY | |
| 200 | 49.57 | BUY | 200 | 52.69 | BUY |
Citigroup Inc
IPO: 2011-05-09
Ticker: CIndices: S&P 500,
Exchange: New York Stock Exchange, Inc. (US - USD)
Website: http://www.citigroup.com/
Phone:
Common Stock
Finance (
National Commercial Banks
 Click to Enlarge