
| Date | Price $ | Result % | Candle Name | Side |
|---|---|---|---|---|
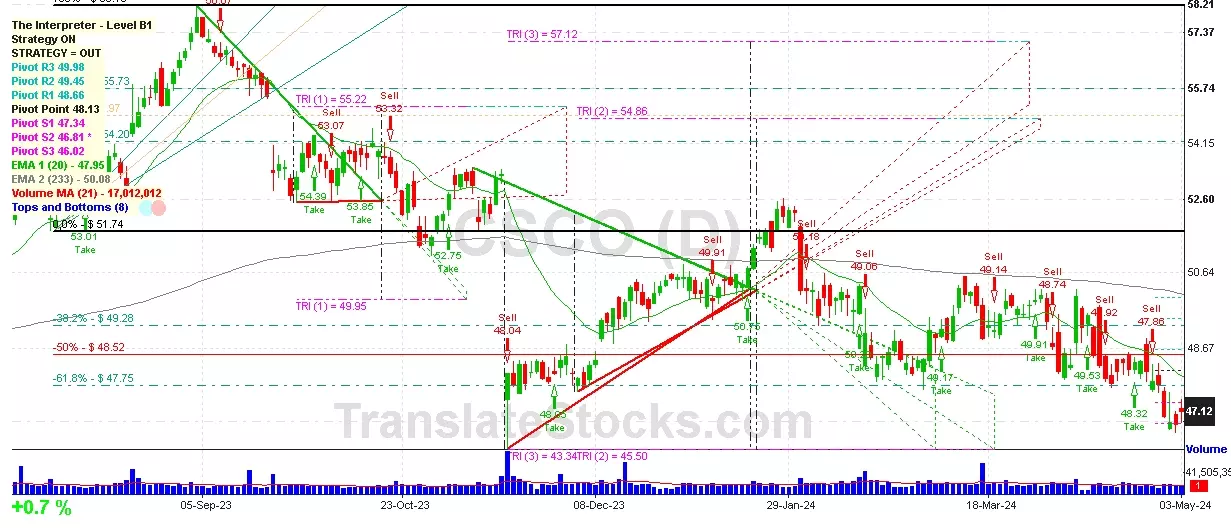
| 001 22 Mar 2024 | Sell Price: 49.78 | Profit: Open Day1 ($ 49.56) | Dark Cloud Cover | Sell |
| 002 08 Mar 2024 | Buy Price: 49.50 | Profit: Open Day1 ($ 49.72) | Engulfing | Buy |
| 003 07 Mar 2024 | Sell Price: 48.90 | Profit: Open Day1 ($ 48.87) | Engulfing | Sell |
| 004 06 Feb 2024 | Buy Price: 49.98 | Profit: Open Day1 ($ 50.30) | Abandoned Baby | Buy |
| 005 20 Jun 2023 | Sell Price: 51.55 | Profit: Open Day1 ($ 51.38) | Abandoned Baby | Sell |
| 006 31 May 2023 | Sell Price: 49.67 | Loss: Close Day2 ($ 50.02) | Abandoned Baby | Sell |
| 007 11 May 2023 | Sell Price: 46.37 | Profit: Open Day1 ($ 46.28) | Engulfing | Sell |
| 008One Year Average | Both Sides Result for 7 Signals |
Profit: $ 0.70 ($ 0.10 / Signal) |
All of Them | Buy + Sell |
| Simple Moving Averages (SMA) Period | Value $ | Signal | Exponential Moving Averages (EMA) Period | Value $ | Signal | |
|---|---|---|---|---|---|---|
| 2 | 46.96 | BUY | 2 | 47.03 | BUY | |
| 3 | 46.92 | BUY | 3 | 47.04 | BUY | |
| 5 | 47.10 | BUY | 5 | 47.16 | SELL | |
| 8 | 47.48 | SELL | 8 | 47.37 | SELL | |
| 13 | 47.73 | SELL | 13 | 47.65 | SELL | |
| 21 | 48.13 | SELL | 21 | 47.98 | SELL | |
| 34 | 48.63 | SELL | 34 | 48.35 | SELL | |
| 55 | 48.75 | SELL | 55 | 48.75 | SELL | |
| 90 | 49.47 | SELL | 90 | 49.26 | SELL | |
| 200 | 51.26 | SELL | 200 | 49.97 | SELL |
Cisco Systems Inc
IPO:
Ticker: CSCOIndices: Dow 30,
S&P 500,
Nasdaq 100,
Exchange: Nasdaq Nms - Global Market (US - USD)
Website: https://www.cisco.com/
Phone:
Common Stock
Technology (
Computer Communications Equipment
Year | 2021 | 2020 | 2019 | 2018 | 2017 | 2016 | 2015 | 2014 | 2013 | 2012 | 2011 | 2010 | 2009 | 2008 | 2007 | |
|---|---|---|---|---|---|---|---|---|---|---|---|---|---|---|---|---|
| 1 | Assets + | 97,497 | 94,853 | 97,793 | 108,784 | 129,818 | 121,652 | 113,481 | 105,134 | 101,191 | 91,759 | 87,095 | 81,130 | 68,128 | 21,734 | 3,728 |
| 2 | Investments in and Advance to Affiliates + | 1,500 | 1,300 | 1,200 | 1,096 | 983 | 1,003 | 897 | 899 | 833 | 153 | 0 | 0 | 0 | 0 | 0 |
| 3 | Cash and Cash Equivalents + | 9,175 | 11,809 | 11,750 | 8,934 | 11,708 | 7,631 | 6,877 | 6,726 | 7,925 | 9,799 | 7,662 | 4,581 | 5,718 | 5,191 | 3,728 |
| 4 | Property + | 2,338 | 2,453 | 2,789 | 3,006 | 3,322 | 3,506 | 3,332 | 3,252 | 3,322 | 3,402 | 3,916 | 3,941 | 4,043 | 4,151 | 0 |
| 5 | Property + | 10,918 | 11,014 | 12,039 | 12,243 | 12,819 | 12,563 | 12,427 | 12,520 | 12,386 | 11,983 | 12,066 | 11,308 | 12,208 | 0 | 0 |
| 6 | Intangible Assets + | 3,619 | 1,576 | 2,201 | 2,552 | 2,539 | 2,501 | 2,376 | 3,280 | 3,403 | 1,959 | 2,541 | 3,274 | 1,702 | 0 | 0 |
| 7 | Finite-Lived Intangible Assets + | 3,114 | 1,363 | 1,865 | 2,449 | 2,428 | 2,279 | 2,359 | 3,148 | 3,317 | -2,618 | 2,363 | 3,078 | 1,702 | 0 | 0 |
| 8 | Liabilities and Equity + | 97,497 | 94,853 | 97,793 | 108,784 | 129,818 | 121,652 | 113,481 | 105,134 | 101,191 | 91,759 | 87,095 | 81,130 | 68,128 | 34,402 | 31,941 |
| 9 | Liabilities + | 56,222 | 56,933 | 64,222 | 65,580 | 63,681 | 58,067 | 53,774 | 48,473 | 42,063 | 40,458 | 39,836 | 36,845 | 29,451 | 0 | 0 |
| 10 | Debt and Lease Obligation + | 0 | 0 | 0 | 0 | 0 | 0 | 0 | 0 | 0 | 31 | 588 | 59 | 2 | 0 | 0 |
| 11 | Stockholders' Equity + | 41,275 | 37,920 | 33,571 | 43,204 | 66,137 | 63,585 | 59,707 | 56,661 | 59,128 | 51,301 | 47,259 | 44,285 | 38,677 | 34,402 | 31,941 |
| 12 | Stockholders' Equity Attributable to Parent + | 41,275 | 37,920 | 33,571 | 43,204 | 66,137 | 63,586 | 59,698 | 56,654 | 59,120 | 51,286 | 47,226 | 44,267 | 38,647 | 0 | 0 |
| 13 | Preferred Stock + | 0 | 0 | 0 | 0 | 0 | 0 | 0 | 0 | 0 | 0 | 0 | 0 | 0 | 0 | 0 |
| 14 | Common Stock + | 0 | 0 | 0 | 0 | 0 | 0 | 0 | 0 | 0 | 0 | 0 | 0 | 0 | 0 | 0 |
| 15 | Partners' Capital + | -654 | -2,763 | -5,903 | 1,233 | 20,838 | 19,396 | 16,045 | 14,093 | 16,215 | 11,354 | 7,284 | 5,851 | 3,868 | 728 | 0 |
| 16 | Partners' Capital + | -654 | -2,763 | -5,903 | 1,233 | 20,838 | 19,396 | 16,045 | 14,093 | 16,215 | 11,354 | 7,284 | 5,851 | 3,868 | 728 | 0 |
| 17 | Limited Liability Company (LLC) Members' Equity + | -1,071 | -3,282 | -6,695 | 384 | 20,884 | 19,070 | 16,106 | 14,770 | 16,823 | 12,015 | 8,578 | 6,474 | 4,303 | 728 | 0 |
| 18 | Limited Liability Company (LLC) Members' Equity + | -1,071 | -3,282 | -6,695 | 384 | 20,884 | 19,070 | 16,106 | 14,770 | 16,823 | 12,015 | 8,578 | 6,474 | 4,303 | 728 | 0 |
| 19 | Current Assets + | 39,112 | 43,573 | 47,755 | 61,837 | 83,703 | 78,719 | 76,283 | 67,114 | 65,521 | 61,933 | 57,231 | 51,421 | 44,177 | 0 | 0 |
| 20 | Cash + | 15,357 | 29,419 | 33,413 | 46,548 | 70,492 | 65,756 | 0 | 0 | 0 | 0 | 44,585 | 39,861 | 35,001 | 0 | 0 |
| 21 | Current Receivables + | 10,146 | 10,523 | 10,586 | 10,503 | 10,002 | 10,119 | 9,835 | 9,310 | 9,507 | 8,030 | 7,809 | 7,232 | 3,177 | 0 | 0 |
| 22 | Inventory + | 1,559 | 1,282 | 1,383 | 1,846 | 1,616 | 1,217 | 1,627 | 1,591 | 1,476 | 1,663 | 1,486 | 1,327 | 1,074 | 0 | 0 |
| 23 | Long-Term Assets + | 48,639 | 42,458 | 40,424 | 36,507 | 35,516 | 32,768 | 27,632 | 27,570 | 25,034 | 20,880 | 19,919 | 22,494 | 18,206 | 12,392 | 0 |
| 24 | Long-term Investments and Receivables + | 4,884 | 5,714 | 4,958 | 4,882 | 4,738 | 4,158 | 3,858 | 3,918 | 3,911 | 3,585 | 3,488 | 2,614 | 0 | 0 | 0 |
| 25 | Long-Term Restricted Cash and Investments + | 753 | 3 | 1 | 27 | 0 | 0 | 0 | 0 | 0 | 0 | 0 | 0 | 0 | 0 | 0 |
| 26 | Long-Term Derivative Instruments and Hedges + | 0 | 0 | 481 | 0 | 0 | 0 | 0 | 0 | 0 | 0 | 0 | 0 | 0 | 0 | 0 |
| 27 | Current Liabilities + | 26,257 | 25,331 | 31,712 | 27,035 | 27,583 | 24,911 | 23,623 | 19,809 | 22,192 | 17,731 | 17,506 | 19,233 | 13,655 | 0 | 0 |
| 28 | Long-Term Other Undisclosed Liabilities | 9,051 | 8,298 | 7,704 | 8,054 | 7,402 | 6,039 | 5,359 | 4,664 | 4,161 | 0 | 0 | 0 | 0 | 0 | 0 |
| 29 | Long-Term Liabilities + | 29,965 | 31,602 | 32,510 | 38,545 | 36,098 | 33,156 | 30,151 | 28,664 | 19,871 | 18,699 | 18,148 | 14,473 | 13,061 | 0 | 0 |
| 30 | Current Capitalized Contract Cost + | 0 | 0 | 416 | 0 | 0 | 0 | 0 | 0 | 0 | 0 | 0 | 0 | 0 | 0 | 0 |
| 31 | Current Other Assets + | 2,889 | 2,349 | 2,789 | 2,940 | 1,593 | 1,627 | 1,490 | 1,331 | 1,312 | 1,230 | 941 | 3,178 | 2,605 | 0 | 0 |
| 32 | Total Current Assets + | 39,112 | 43,573 | 47,755 | 61,837 | 83,703 | 78,719 | 76,283 | 67,114 | 65,521 | 61,933 | 57,231 | 51,421 | 44,177 | 0 | 0 |
| 33 | Operating Lease + | 1,095 | 921 | 0 | 0 | 0 | 0 | 0 | 0 | 0 | 0 | 0 | 0 | 0 | 0 | 0 |
| 34 | Goodwill + | 38,168 | 33,806 | 33,529 | 31,706 | 29,766 | 26,625 | 24,469 | 24,239 | 21,919 | 16,998 | 16,818 | 16,674 | 12,925 | 12,392 | 0 |
| 35 | Long-Term Capitalized Contract Cost + | 0 | 0 | 334 | 0 | 0 | 0 | 0 | 0 | 0 | 0 | 0 | 0 | 0 | 0 | 0 |
| 36 | Long-Term Other Assets + | 5,016 | 3,741 | 2,830 | 1,582 | 1,511 | 1,844 | 3,163 | 3,331 | 3,115 | 3,882 | 3,101 | 5,820 | 5,281 | 0 | 0 |
| 37 | Deferred Income Tax Assets + | 9,376 | 7,731 | 4,065 | 4,801 | 5,750 | 6,143 | 0 | 0 | 0 | 0 | 0 | 0 | 0 | 0 | 0 |
| 38 | Total Assets + | 97,497 | 94,853 | 97,793 | 108,784 | 129,818 | 121,652 | 113,481 | 105,134 | 101,191 | 91,759 | 87,095 | 81,130 | 68,128 | 0 | 0 |
| 39 | Total Liabilities + | 56,222 | 56,933 | 64,222 | 65,580 | 63,681 | 58,067 | 53,774 | 48,473 | 42,063 | 40,458 | 39,836 | 36,845 | 29,451 | 0 | 0 |
| 40 | Stockholders' Equity Attributable to Noncontrolling Interest + | 0 | 0 | 0 | 0 | 0 | -1 | 9 | 7 | 8 | 15 | 33 | 18 | 30 | 0 | 0 |
| 41 | Total Stockholders' Equity + | 0 | 0 | 33,571 | 43,204 | 66,137 | 63,585 | 59,707 | 56,661 | 59,128 | 51,301 | 47,259 | 44,285 | 38,677 | 34,402 | 31,941 |
| 42 | Total Liabilities and Equity + | 97,497 | 94,853 | 97,793 | 108,784 | 129,818 | 121,652 | 113,481 | 105,134 | 101,191 | 91,759 | 87,095 | 81,130 | 68,128 | 0 | 0 |
Year | 2021 | 2020 | 2019 | 2018 | 2017 | 2016 | 2015 | 2014 | 2013 | 2012 | 2011 | 2010 | 2009 | 2008 | |
|---|---|---|---|---|---|---|---|---|---|---|---|---|---|---|---|
| 1 | 151 | 190 | 0 | 0 | 0 | 0 | 0 | 0 | 0 | 0 | 0 | 0 | 0 | 0 | |
| 2 | 75 | 94 | 0 | 0 | 0 | 0 | 0 | 0 | 0 | 0 | 0 | 0 | 0 | 0 | |
| 3 | 75 | 94 | 0 | 0 | 0 | 0 | 0 | 0 | 0 | 0 | 0 | 0 | 0 | 0 | |
| 4 | 0 | 0 | 0 | 49,330 | 48,005 | 49,247 | 49,161 | 47,142 | 48,607 | 46,061 | 43,218 | 40,040 | 0 | 0 | |
| 5 | -17,924 | -17,618 | -19,238 | -18,724 | -17,781 | -18,287 | -19,480 | -19,373 | -19,167 | -17,852 | -16,682 | -14,397 | 0 | 0 | |
| 6 | 0 | 0 | 0 | 0 | 0 | 0 | 0 | 0 | 0 | 0 | -16,682 | -14,397 | -13,023 | -14,194 | |
| 7 | 31,894 | 31,683 | 32,666 | 30,606 | 30,224 | 30,960 | 29,681 | 27,769 | 29,440 | 28,209 | 26,536 | 25,643 | 23,094 | 25,346 | |
| 8 | 0 | 0 | 0 | 0 | 0 | 0 | 0 | 0 | 0 | 0 | 0 | 0 | 63 | 3 | |
| 9 | 6,549 | 6,347 | 6,577 | 6,332 | 6,059 | 6,296 | 6,207 | 6,294 | 5,942 | 5,488 | 5,823 | 0 | 0 | 0 | |
| 10 | 0 | 0 | 0 | 0 | 0 | 0 | 0 | 0 | 0 | 15 | 10 | 40 | 0 | 0 | |
| 11 | 9,259 | 9,169 | 9,571 | 9,242 | 9,184 | 9,619 | 9,821 | 9,503 | 9,538 | 9,647 | 9,812 | 8,716 | 8,403 | 8,690 | |
| 12 | 2,152 | 1,925 | 1,827 | 2,144 | 1,993 | 1,814 | 2,040 | 1,934 | 2,264 | 2,322 | 1,908 | 1,999 | 1,565 | 1,387 | |
| 13 | -6 | 93 | 40 | -134 | -8 | -9 | 134 | 79 | 44 | 50 | 89 | 44 | 54 | 34 | |
| 14 | 0 | -76 | -69 | 0 | 0 | 0 | 0 | 0 | 0 | 0 | 0 | 0 | 0 | 0 | |
| 15 | -19,061 | -18,063 | -18,447 | -18,297 | -18,251 | -18,300 | -18,911 | -18,424 | -18,244 | -18,144 | -18,862 | -16,479 | -15,772 | -15,904 | |
| 16 | 12,833 | 13,620 | 14,219 | 12,309 | 11,973 | 12,660 | 10,770 | 9,345 | 11,196 | 10,065 | 7,674 | 9,164 | 7,322 | 9,442 | |
| 17 | 354 | 138 | 24 | 322 | -154 | 317 | 258 | 299 | -9 | 31 | 213 | 223 | -80 | 103 | |
| 18 | 618 | 920 | 1,308 | 1,508 | 1,338 | 1,005 | 769 | 691 | 654 | 650 | 641 | 635 | 845 | 1,143 | |
| 19 | 245 | 15 | -97 | 165 | -163 | -69 | 228 | 243 | -40 | 40 | 138 | 239 | -128 | -11 | |
| 20 | 429 | 350 | 352 | 730 | 314 | 260 | 431 | 370 | 31 | 94 | 151 | 251 | 371 | 813 | |
| 21 | 434 | 585 | 859 | 943 | 861 | 676 | 566 | 564 | 583 | 596 | 628 | 623 | 346 | 319 | |
| 22 | 0 | 0 | 0 | 0 | 0 | 0 | 0 | 0 | 0 | -239 | -76 | -3 | 0 | 0 | |
| 23 | 13,262 | 13,970 | 14,571 | 13,039 | 12,287 | 12,920 | 11,201 | 9,715 | 11,227 | 10,159 | 7,825 | 0 | 0 | 0 | |
| 24 | -2,671 | -2,756 | -2,950 | -12,929 | -2,678 | -2,181 | -2,220 | -1,862 | -1,244 | -2,118 | -1,335 | -1,648 | -1,559 | -2,203 | |
| 25 | Total Net Income (Loss) Attributable to Parent + | 10,591 | 11,214 | 11,621 | 110 | 9,609 | 10,739 | 8,981 | 7,853 | 9,983 | 8,041 | 6,490 | 7,767 | 6,134 | 8,052 |
| 26 | Total Earnings Per Share + | 2.51 | 2.65 | 2.63 | 0.02 | 1.92 | 2.13 | 1.76 | 1.50 | 1.87 | 1.50 | 1.17 | 1.36 | 1.05 | 1.35 |
| 27 | Total Earnings Per Share + | 2.50 | 2.64 | 2.61 | 0.02 | 1.90 | 2.11 | 1.75 | 1.49 | 1.86 | 1.49 | 1.17 | 1.33 | 1.05 | 1.31 |
| 28 | 1.46 | 1.42 | 1.36 | 1.24 | 1.10 | 0.94 | 0.80 | 0.72 | 0.62 | 0.28 | 0.12 | 0 | 0 | 0 | |
| 29 | 2.92 | 2.84 | 2.72 | 2.48 | 2.20 | 1.88 | 1.60 | 1.44 | 1.24 | 0.56 | 0.24 | 0 | 0 | 0 |

 Click to Enlarge