| Date | Price $ | Result % | Candle Name | Side |
|---|---|---|---|---|
| 001 24 Apr 2024 | Buy Price: 143.41 | Loss: Close Day2 ($ 142.07) | Engulfing | Buy |
| 002 24 Apr 2024 | Buy Price: 143.16 | Loss: Close Day2 ($ 142.07) | Piercing Line | Buy |
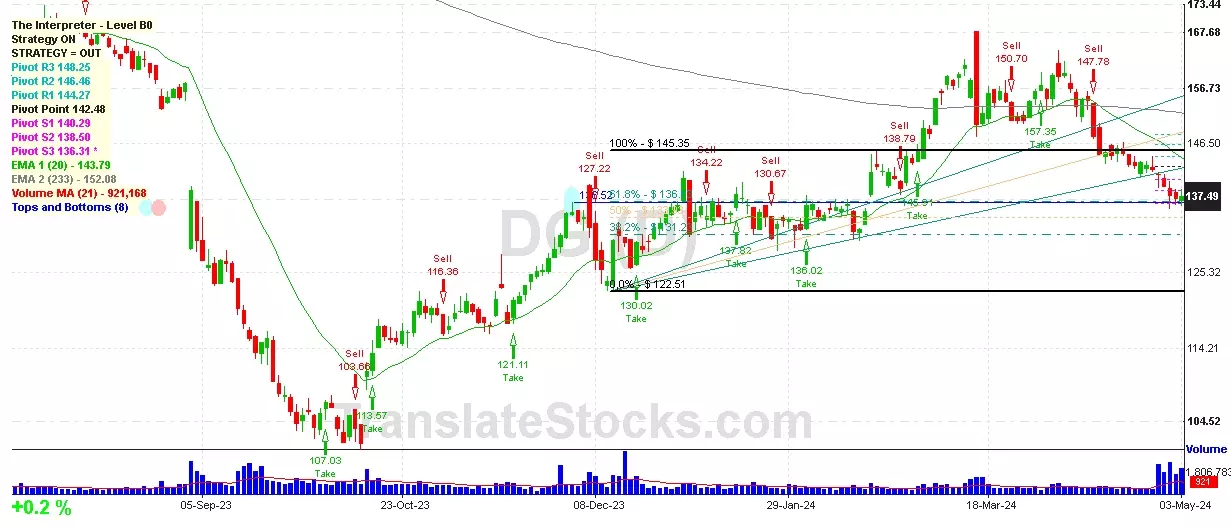
| 003 13 Mar 2024 | Sell Price: 158.17 | Profit: Close Day1 ($ 150.06) | Abandoned Baby | Sell |
| 004 08 Mar 2024 | Sell Price: 157.31 | Loss: Close Day2 ($ 161.22) | Abandoned Baby | Sell |
| 005 12 Jan 2024 | Buy Price: 134.64 | Profit: Open Day1 ($ 135.63) | Engulfing | Buy |
| 006 25 Oct 2023 | Buy Price: 119.47 | Profit: Close Day1 ($ 120.94) | Engulfing | Buy |
| 007 03 Oct 2023 | Buy Price: 105.59 | Profit: Open Day1 ($ 106.00) | Engulfing | Buy |
| 008 08 Sep 2023 | Buy Price: 127.20 | Loss: Close Day2 ($ 123.89) | Engulfing | Buy |
| 009 19 May 2023 | Sell Price: 215.08 | Profit: Open Day1 ($ 213.89) | Engulfing | Sell |
| 010One Year Average | Both Sides Result for 9 Signals |
Profit: $ 2.52 ($ 0.28 / Signal) |
All of Them | Buy + Sell |
| Simple Moving Averages (SMA) Period | Value $ | Signal | Exponential Moving Averages (EMA) Period | Value $ | Signal | |
|---|---|---|---|---|---|---|
| 2 | 137.32 | BUY | 2 | 137.51 | SELL | |
| 3 | 137.41 | BUY | 3 | 137.80 | SELL | |
| 5 | 138.51 | SELL | 5 | 138.56 | SELL | |
| 8 | 140.06 | SELL | 8 | 139.77 | SELL | |
| 13 | 141.62 | SELL | 13 | 141.70 | SELL | |
| 21 | 145.58 | SELL | 21 | 144.02 | SELL | |
| 34 | 149.12 | SELL | 34 | 145.67 | SELL | |
| 55 | 148.91 | SELL | 55 | 145.43 | SELL | |
| 90 | 143.31 | SELL | 90 | 143.79 | SELL | |
| 200 | 136.93 | BUY | 200 | 148.91 | SELL |
Dollar General Corp
IPO: 2009-11-13
Ticker: DGIndices: S&P 500,
Exchange: New York Stock Exchange, Inc. (US - USD)
Website: https://www.dollargeneral.com/
Phone:
Common Stock
Trade & Services (
Retail-variety Stores

 Click to Enlarge