
| Date | Price $ | Result % | Candle Name | Side |
|---|---|---|---|---|
| 001 30 Apr 2024 | Sell Price: 94.44 | Loss: Close Day2 ($ 95.92) | Abandoned Baby | Sell |
| 002 29 Apr 2024 | Buy Price: 97.34 | Loss: Close Day2 ($ 94.76) | Abandoned Baby | Buy |
| 003 04 Apr 2024 | Sell Price: 99.67 | Profit: Open Day1 ($ 99.61) | Engulfing | Sell |
| 004 23 Jan 2024 | Sell Price: 86.66 | Profit: Open Day1 ($ 86.03) | Engulfing | Sell |
| 005 23 Jan 2024 | Sell Price: 86.90 | Profit: Open Day1 ($ 86.03) | Dark Cloud Cover | Sell |
| 006 05 Sep 2023 | Sell Price: 81.86 | Profit: Close Day2 ($ 80.27) | Abandoned Baby | Sell |
| 007 25 Aug 2023 | Buy Price: 81.93 | Profit: Open Day1 ($ 82.14) | Abandoned Baby | Buy |
| 008 20 Jul 2023 | Sell Price: 87.58 | Profit: Close Day1 ($ 87.23) | Engulfing | Sell |
| 009 23 Jun 2023 | Buy Price: 78.55 | Profit: Open Day1 ($ 78.61) | Piercing Line | Buy |
| 010 08 Jun 2023 | Sell Price: 80.42 | Profit: Open Day1 ($ 79.87) | Engulfing | Sell |
| 011One Year Average | Both Sides Result for 10 Signals |
Profit: $ 0.26 ($ 0.03 / Signal) |
All of Them | Buy + Sell |
| Simple Moving Averages (SMA) Period | Value $ | Signal | Exponential Moving Averages (EMA) Period | Value $ | Signal | |
|---|---|---|---|---|---|---|
| 2 | 98.13 | BUY | 2 | 98.12 | BUY | |
| 3 | 97.39 | BUY | 3 | 97.63 | BUY | |
| 5 | 96.27 | BUY | 5 | 97.09 | BUY | |
| 8 | 96.30 | BUY | 8 | 96.80 | BUY | |
| 13 | 96.39 | BUY | 13 | 96.78 | BUY | |
| 21 | 97.33 | BUY | 21 | 96.73 | BUY | |
| 34 | 97.68 | BUY | 34 | 96.02 | BUY | |
| 55 | 94.14 | BUY | 55 | 94.35 | BUY | |
| 90 | 90.91 | BUY | 90 | 91.88 | BUY | |
| 200 | 85.20 | BUY | 200 | 88.06 | BUY |
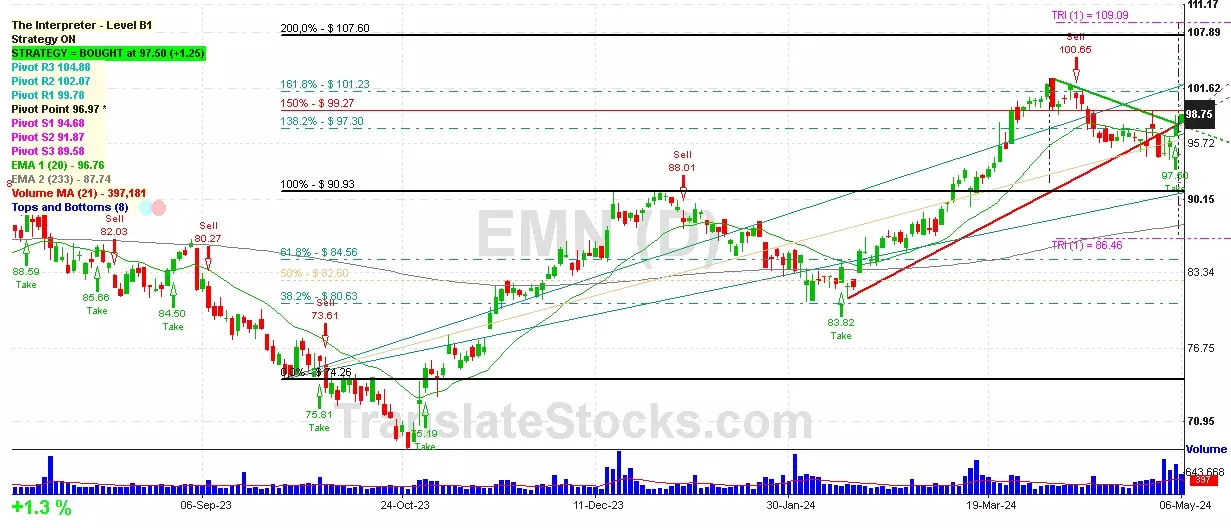
Eastman Chemical Co
IPO: 1993-12-14
Ticker: EMNIndices: S&P 500,
Exchange: New York Stock Exchange, Inc. (US - USD)
Website: http://www.eastman.com
Phone:
Common Stock
Life Sciences (
Plastic Materials, Synth Resins & Nonvulcan Elastomers

 Click to Enlarge