
| Date | Price $ | Result % | Candle Name | Side |
|---|---|---|---|---|
| 001 18 Jan 2024 | Buy Price: 240.12 | Profit: Open Day1 ($ 241.77) | Abandoned Baby | Buy |
| 002 18 Jan 2024 | Buy Price: 240.15 | Profit: Open Day1 ($ 241.77) | Engulfing | Buy |
| 003 02 Jan 2024 | Sell Price: 238.90 | Profit: Open Day1 ($ 237.40) | Abandoned Baby | Sell |
| 004 15 Dec 2023 | Sell Price: 237.41 | Profit: Close Day1 ($ 237.13) | Abandoned Baby | Sell |
| 005 21 Nov 2023 | Buy Price: 227.01 | Profit: Open Day1 ($ 227.88) | Engulfing | Buy |
| 006 11 Aug 2023 | Buy Price: 218.36 | Profit: Close Day1 ($ 219.04) | Abandoned Baby | Buy |
| 007 21 Jul 2023 | Sell Price: 207.69 | Profit: Close Day1 ($ 207.36) | Abandoned Baby | Sell |
| 008 12 Jul 2023 | Sell Price: 201.92 | Loss: Close Day2 ($ 203.46) | Dark Cloud Cover | Sell |
| 009 28 Jun 2023 | Sell Price: 194.75 | Loss: Close Day2 ($ 201.10) | Engulfing | Sell |
| 010 23 Jun 2023 | Sell Price: 194.46 | Loss: Close Day2 ($ 197.65) | Abandoned Baby | Sell |
| 011 20 Jun 2023 | Buy Price: 194.23 | Profit: Close Day1 ($ 194.84) | Engulfing | Buy |
| 012 08 May 2023 | Sell Price: 169.63 | Profit: Open Day1 ($ 169.31) | Engulfing | Sell |
| 013 08 May 2023 | Sell Price: 169.88 | Profit: Open Day1 ($ 169.31) | Dark Cloud Cover | Sell |
| 014One Year Average | Both Sides Result for 13 Signals |
Loss: $ -2.65 ($ -0.20 / Signal) |
All of Them | Buy + Sell |
| Simple Moving Averages (SMA) Period | Value $ | Signal | Exponential Moving Averages (EMA) Period | Value $ | Signal | |
|---|---|---|---|---|---|---|
| 2 | 320.70 | BUY | 2 | 321.80 | BUY | |
| 3 | 320.06 | BUY | 3 | 320.05 | BUY | |
| 5 | 316.22 | BUY | 5 | 317.72 | BUY | |
| 8 | 312.91 | BUY | 8 | 316.16 | BUY | |
| 13 | 314.16 | BUY | 13 | 315.19 | BUY | |
| 21 | 315.94 | BUY | 21 | 313.52 | BUY | |
| 34 | 311.93 | BUY | 34 | 308.85 | BUY | |
| 55 | 301.39 | BUY | 55 | 299.38 | BUY | |
| 90 | 279.42 | BUY | 90 | 284.62 | BUY | |
| 200 | 245.42 | BUY | 200 | 252.58 | BUY |
Eaton Corp Plc
IPO: 2012-12-03
Ticker: ETNIndices: S&P 500,
Exchange: New York Stock Exchange, Inc. (IE - USD)
Website: http://www.eaton.com
Phone:
Common Stock
Technology (
Misc Industrial & Commercial Machinery & Equipment

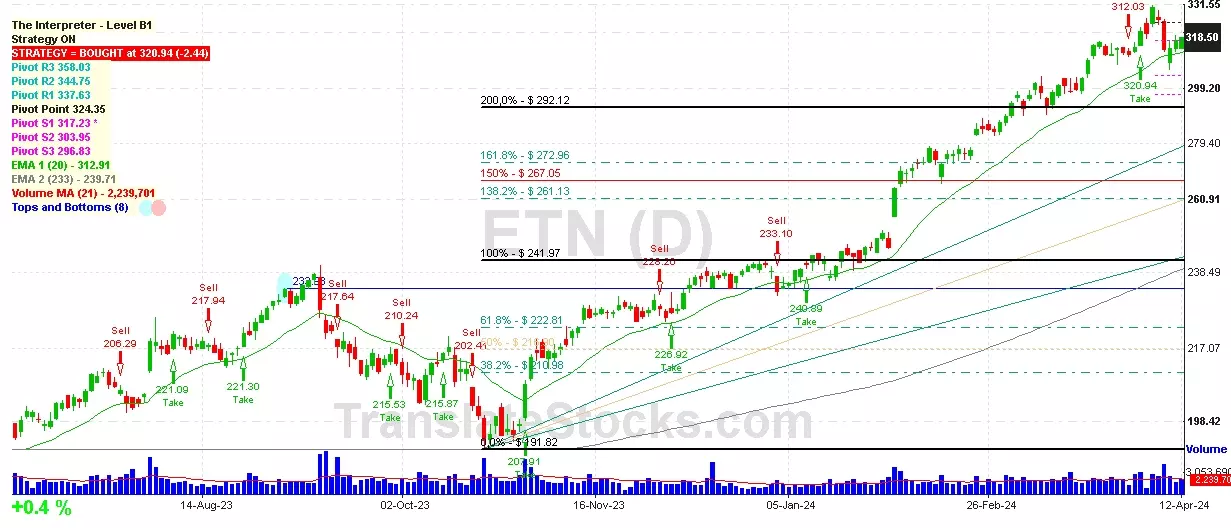 Click to Enlarge