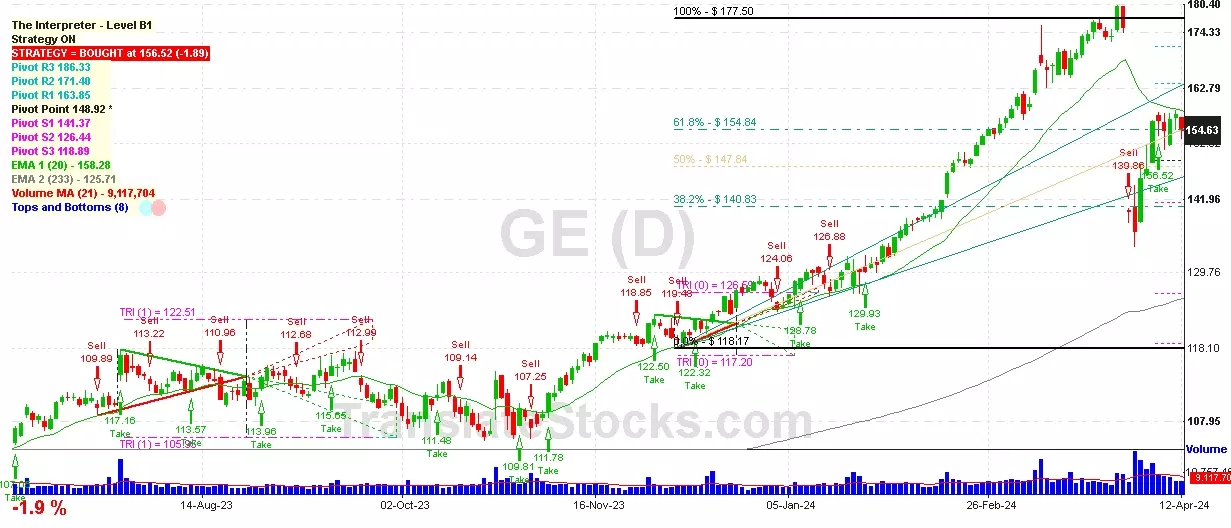
Hey Friend, I'm analysing GENERAL ELECTRIC CO (GE), and it is between the Support of $ 148.92 (Pivot) and the Resistance of $ 154.84 (61.8% of Fibonacci). The stock is also approaching the line of Pivot at $ 148.92, and if it goes below this line it could reach the next Support of 50% of Fibonacci at $ 147.84.

| Date | Price $ | Result % | Candle Name | Side |
|---|---|---|---|---|
| 001 09 Apr 2024 | Sell Price: 154.49 | Profit: Open Day1 ($ 151.89) | Abandoned Baby | Sell |
| 002 21 Feb 2024 | Buy Price: 149.07 | Profit: Open Day1 ($ 149.85) | Engulfing | Buy |
| 003 17 Oct 2023 | Buy Price: 110.02 | Loss: Close Day2 ($ 106.95) | Engulfing | Buy |
| 004 17 Oct 2023 | Buy Price: 109.82 | Loss: Close Day2 ($ 106.95) | Piercing Line | Buy |
| 005 08 Jun 2023 | Sell Price: 106.07 | Loss: Close Day2 ($ 106.23) | Abandoned Baby | Sell |
| 006 25 May 2023 | Buy Price: 101.52 | Profit: Open Day1 ($ 101.59) | Abandoned Baby | Buy |
| 007One Year Average | Both Sides Result for 6 Signals |
Loss: $ -2.65 ($ -0.44 / Signal) |
All of Them | Buy + Sell |
| Simple Moving Averages (SMA) Period | Value $ | Signal | Exponential Moving Averages (EMA) Period | Value $ | Signal | |
|---|---|---|---|---|---|---|
| 2 | 161.81 | BUY | 2 | 161.73 | BUY | |
| 3 | 160.93 | BUY | 3 | 160.97 | BUY | |
| 5 | 159.12 | BUY | 5 | 159.57 | BUY | |
| 8 | 156.54 | BUY | 8 | 158.32 | BUY | |
| 13 | 156.28 | BUY | 13 | 157.78 | BUY | |
| 21 | 154.47 | BUY | 21 | 158.10 | BUY | |
| 34 | 161.17 | BUY | 34 | 157.75 | BUY | |
| 55 | 157.81 | BUY | 55 | 154.77 | BUY | |
| 90 | 146.82 | BUY | 90 | 148.41 | BUY | |
| 200 | 128.59 | BUY | 200 | 132.88 | BUY |
General Electric Co
IPO: 1892-06-23
Ticker: GEIndices: S&P 500,
Exchange: New York Stock Exchange, Inc. (US - USD)
Website: https://www.ge.com
Phone:
Common Stock
Manufacturing (
Electronic & Other Electrical Equipment (no Computer Equip)
 Click to Enlarge