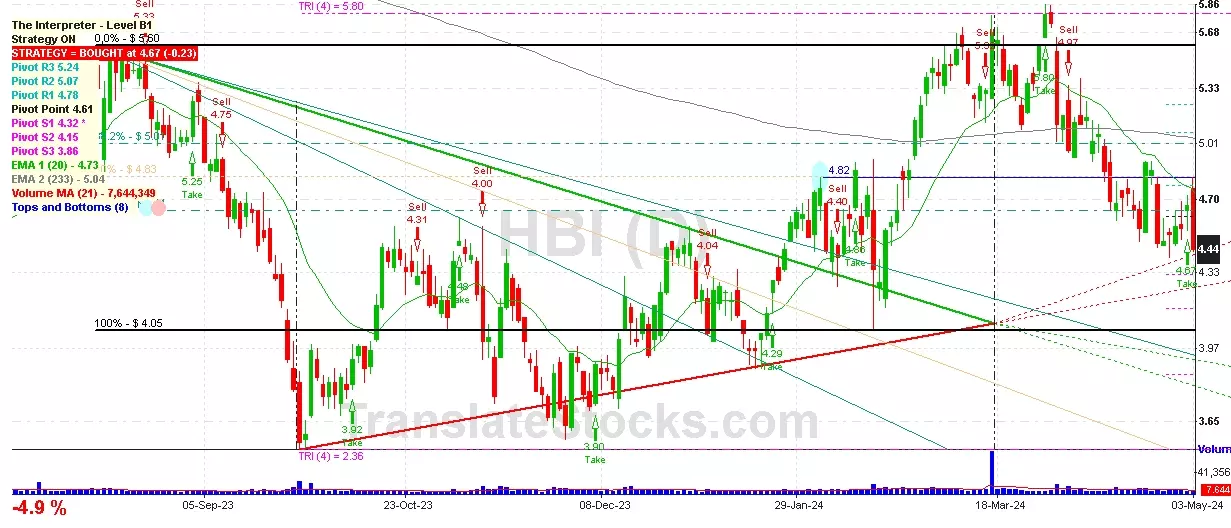
Hey Friend, I'm analysing HANESBRANDS INC (HBI), and it is between the Support of $ 4.32 (PivotS1) and the Resistance of $ 4.55 (61.8% of Fibonacci). The stock is also approaching the line of PivotS1 at $ 4.32, and if it goes below this line it could reach the next Support of 100% of Fibonacci at $ 4.05.

| Date | Price $ | Result % | Candle Name | Side |
|---|---|---|---|---|
| 001 23 Apr 2024 | Buy Price: 4.90 | Loss: Close Day2 ($ 4.47) | Engulfing | Buy |
| 002 17 Apr 2024 | Buy Price: 4.71 | Profit: Open Day1 ($ 4.76) | Abandoned Baby | Buy |
| 003 11 Apr 2024 | Buy Price: 5.06 | Loss: Close Day2 ($ 4.69) | Abandoned Baby | Buy |
| 004 13 Mar 2024 | Buy Price: 5.34 | Profit: Close Day2 ($ 5.68) | Engulfing | Buy |
| 005 08 Jan 2024 | Buy Price: 4.24 | Profit: Close Day1 ($ 4.26) | Engulfing | Buy |
| 006 01 Dec 2023 | Buy Price: 3.95 | Loss: Close Day2 ($ 3.77) | Engulfing | Buy |
| 007 15 Jun 2023 | Buy Price: 4.74 | Loss: Close Day2 ($ 4.72) | Engulfing | Buy |
| 008 15 Jun 2023 | Buy Price: 4.72 | Loss: Close Day2 ($ 4.72) | Piercing Line | Buy |
| 009One Year Average | Both Sides Result for 8 Signals |
Loss: $ -0.59 ($ -0.07 / Signal) |
All of Them | Buy + Sell |
| Simple Moving Averages (SMA) Period | Value $ | Signal | Exponential Moving Averages (EMA) Period | Value $ | Signal | |
|---|---|---|---|---|---|---|
| 2 | 4.56 | SELL | 2 | 4.50 | SELL | |
| 3 | 4.55 | SELL | 3 | 4.53 | SELL | |
| 5 | 4.55 | SELL | 5 | 4.55 | SELL | |
| 8 | 4.57 | SELL | 8 | 4.58 | SELL | |
| 13 | 4.62 | SELL | 13 | 4.64 | SELL | |
| 21 | 4.75 | SELL | 21 | 4.74 | SELL | |
| 34 | 4.99 | SELL | 34 | 4.84 | SELL | |
| 55 | 5.05 | SELL | 55 | 4.85 | SELL | |
| 90 | 4.79 | SELL | 90 | 4.79 | SELL | |
| 200 | 4.60 | SELL | 200 | 4.88 | SELL |
Hanesbrands Inc
IPO: 2006-08-16
Ticker: HBIIndices: S&P 500,
Exchange: New York Stock Exchange, Inc. (US - USD)
Website: https://www.hanes.com/corporate
Phone:
Common Stock
Trade & Services (
Retail-apparel & Accessory Stores
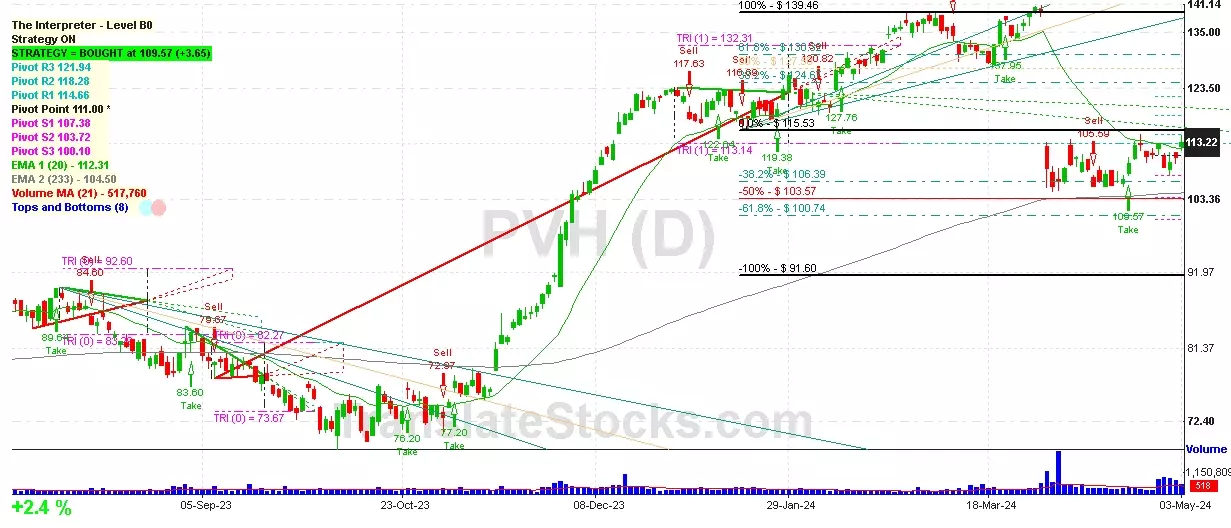
 Click to Enlarge