| Date | Price $ | Result % | Candle Name | Side |
|---|---|---|---|---|
| 001 11 Apr 2024 | Buy Price: 196.87 | Profit: Open Day2 ($ 198.11) | Abandoned Baby | Buy |
| 002 11 Apr 2024 | Buy Price: 197.16 | Profit: Open Day2 ($ 198.11) | Engulfing | Buy |
| 003 08 Mar 2024 | Sell Price: 200.75 | Profit: Close Day1 ($ 200.29) | Engulfing | Sell |
| 004 29 Feb 2024 | Buy Price: 198.73 | Profit: Close Day2 ($ 199.24) | Abandoned Baby | Buy |
| 005 09 Feb 2024 | Buy Price: 194.84 | Profit: Close Day1 ($ 197.35) | Engulfing | Buy |
| 006 06 Feb 2024 | Buy Price: 193.64 | Profit: Open Day1 ($ 195.47) | Piercing Line | Buy |
| 007 27 Nov 2023 | Sell Price: 192.97 | Loss: Close Day2 ($ 194.26) | Abandoned Baby | Sell |
| 008 20 Sep 2023 | Sell Price: 194.44 | Profit: Close Day1 ($ 191.43) | Dark Cloud Cover | Sell |
| 009 08 Sep 2023 | Buy Price: 184.52 | Profit: Open Day1 ($ 185.93) | Piercing Line | Buy |
| 010 18 Aug 2023 | Buy Price: 186.58 | Profit: Close Day1 ($ 186.95) | Piercing Line | Buy |
| 011 20 Jul 2023 | Buy Price: 207.96 | Profit: Open Day1 ($ 208.31) | Abandoned Baby | Buy |
| 012 12 Jul 2023 | Sell Price: 208.52 | Profit: Open Day1 ($ 207.67) | Dark Cloud Cover | Sell |
| 013 29 Jun 2023 | Buy Price: 206.47 | Profit: Open Day1 ($ 207.67) | Engulfing | Buy |
| 014One Year Average | Both Sides Result for 13 Signals |
Profit: $ 13.40 ($ 1.03 / Signal) |
All of Them | Buy + Sell |
| Simple Moving Averages (SMA) Period | Value $ | Signal | Exponential Moving Averages (EMA) Period | Value $ | Signal | |
|---|---|---|---|---|---|---|
| 2 | 194.73 | BUY | 2 | 195.19 | BUY | |
| 3 | 194.92 | BUY | 3 | 194.88 | BUY | |
| 5 | 194.25 | BUY | 5 | 194.56 | BUY | |
| 8 | 194.06 | BUY | 8 | 194.39 | BUY | |
| 13 | 193.84 | BUY | 13 | 194.51 | BUY | |
| 21 | 194.61 | BUY | 21 | 195.07 | BUY | |
| 34 | 196.82 | SELL | 34 | 195.93 | SELL | |
| 55 | 197.69 | SELL | 55 | 196.70 | SELL | |
| 90 | 198.94 | SELL | 90 | 196.92 | SELL | |
| 200 | 194.35 | BUY | 200 | 196.41 | SELL |
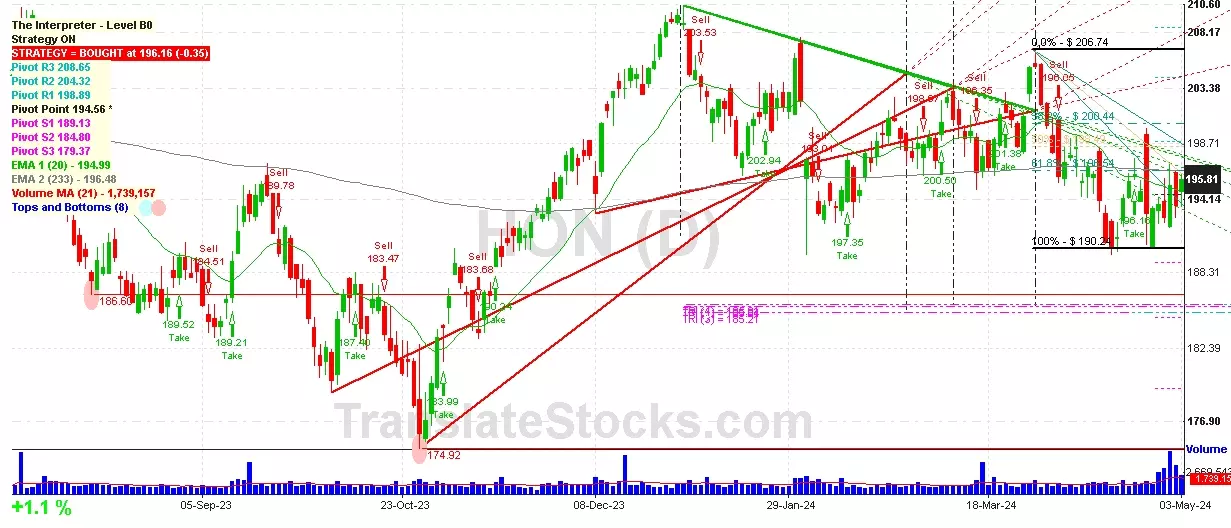
Honeywell International Inc
IPO: 1985-09-19
Website: https://www.honeywell.com/
Phone:
Common Stock
Manufacturing (
Aircraft Engines & Engine Parts

 Click to Enlarge