
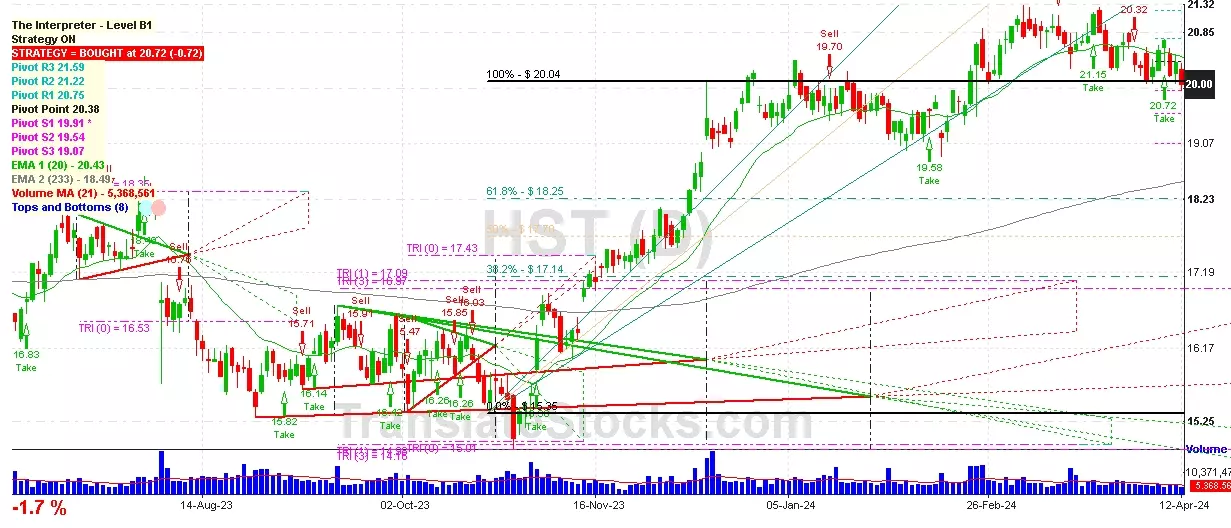
Hey Friend, I'm analysing HOST HOTELS & RESORTS INC (HST), and it is between the Support of $ 19.91 (PivotS1) and the Resistance of $ 20.04 (100% of Fibonacci). The stock is also approaching the line of PivotS1 at $ 19.91, and if it goes below this line it could reach the next Support of 61.8% of Fibonacci at $ 18.25.

| Date | Price $ | Result % | Candle Name | Side |
|---|---|---|---|---|
| 001 13 Mar 2024 | Sell Price: 20.81 | Profit: Close Day1 ($ 20.67) | Engulfing | Sell |
| 002 23 Feb 2024 | Sell Price: 20.27 | Profit: Open Day1 ($ 20.20) | Engulfing | Sell |
| 003 21 Feb 2024 | Buy Price: 20.21 | Profit: Open Day1 ($ 20.32) | Abandoned Baby | Buy |
| 004 06 Feb 2024 | Buy Price: 19.47 | Profit: Open Day1 ($ 19.55) | Abandoned Baby | Buy |
| 005 28 Aug 2023 | Buy Price: 15.83 | Profit: Open Day1 ($ 15.89) | Abandoned Baby | Buy |
| 006 25 Jul 2023 | Buy Price: 17.47 | Profit: Open Day2 ($ 17.54) | Piercing Line | Buy |
| 007 26 Jun 2023 | Buy Price: 16.43 | Profit: Close Day1 ($ 16.63) | Engulfing | Buy |
| 008One Year Average | Both Sides Result for 7 Signals |
Profit: $ 0.73 ($ 0.10 / Signal) |
All of Them | Buy + Sell |
| Simple Moving Averages (SMA) Period | Value $ | Signal | Exponential Moving Averages (EMA) Period | Value $ | Signal | |
|---|---|---|---|---|---|---|
| 2 | 18.88 | SELL | 2 | 18.91 | SELL | |
| 3 | 19.03 | SELL | 3 | 18.95 | SELL | |
| 5 | 19.07 | SELL | 5 | 19.00 | SELL | |
| 8 | 18.93 | SELL | 8 | 19.10 | SELL | |
| 13 | 19.27 | SELL | 13 | 19.29 | SELL | |
| 21 | 19.72 | SELL | 21 | 19.55 | SELL | |
| 34 | 20.11 | SELL | 34 | 19.77 | SELL | |
| 55 | 20.15 | SELL | 55 | 19.81 | SELL | |
| 90 | 19.96 | SELL | 90 | 19.55 | SELL | |
| 200 | 18.14 | BUY | 200 | 18.70 | BUY |
Host Hotels & Resorts Inc
IPO: 1998-12-29
Ticker: HSTIndices: S&P 500,
Exchange: Nasdaq Nms - Global Market (US - USD)
Website: https://www.hosthotels.com/
Phone:
REIT (Real Estate Investment Trust)
Real Estate & Construction (
Real Estate Investment Trusts
 Click to Enlarge