| Date | Price $ | Result % | Candle Name | Side |
|---|---|---|---|---|
| 001 30 Apr 2024 | Sell Price: 147.94 | Profit: Open Day1 ($ 147.20) | Abandoned Baby | Sell |
| 002 04 Apr 2024 | Sell Price: 154.85 | Profit: Open Day1 ($ 154.69) | Dark Cloud Cover | Sell |
| 003 20 Feb 2024 | Sell Price: 154.43 | Profit: Open Day1 ($ 140.29) | Abandoned Baby | Sell |
| 004 12 Feb 2024 | Sell Price: 159.07 | Profit: Open Day1 ($ 155.49) | Abandoned Baby | Sell |
| 005 11 Jan 2024 | Sell Price: 152.09 | Profit: Close Day1 ($ 151.95) | Dark Cloud Cover | Sell |
| 006 20 Sep 2023 | Sell Price: 132.54 | Profit: Open Day1 ($ 130.99) | Dark Cloud Cover | Sell |
| 007 15 Sep 2023 | Sell Price: 132.86 | Profit: Open Day1 ($ 131.46) | Engulfing | Sell |
| 008 15 Sep 2023 | Sell Price: 133.09 | Profit: Open Day1 ($ 131.46) | Dark Cloud Cover | Sell |
| 009 31 May 2023 | Sell Price: 161.80 | Loss: Close Day2 ($ 163.26) | Abandoned Baby | Sell |
| 010 11 May 2023 | Sell Price: 144.51 | Loss: Close Day2 ($ 148.80) | Engulfing | Sell |
| 011One Year Average | Both Sides Result for 10 Signals |
Profit: $ 17.59 ($ 1.76 / Signal) |
All of Them | Buy + Sell |
| Simple Moving Averages (SMA) Period | Value $ | Signal | Exponential Moving Averages (EMA) Period | Value $ | Signal | |
|---|---|---|---|---|---|---|
| 2 | 148.09 | BUY | 2 | 148.35 | BUY | |
| 3 | 147.04 | BUY | 3 | 148.01 | BUY | |
| 5 | 147.85 | BUY | 5 | 147.81 | BUY | |
| 8 | 147.73 | BUY | 8 | 147.92 | BUY | |
| 13 | 147.33 | BUY | 13 | 148.58 | BUY | |
| 21 | 150.88 | SELL | 21 | 149.66 | SELL | |
| 34 | 151.88 | SELL | 34 | 150.79 | SELL | |
| 55 | 152.37 | SELL | 55 | 151.35 | SELL | |
| 90 | 153.42 | SELL | 90 | 150.78 | SELL | |
| 200 | 145.20 | BUY | 200 | 150.09 | SELL |
Keysight Technologies In
IPO: 2014-10-20
Ticker: KEYSIndices: S&P 500,
Exchange: New York Stock Exchange, Inc. (US - USD)
Website: https://www.keysight.com/us/en/home.html
Phone:
Common Stock
Life Sciences (
Industrial Instruments For Measurement, Display, And Control

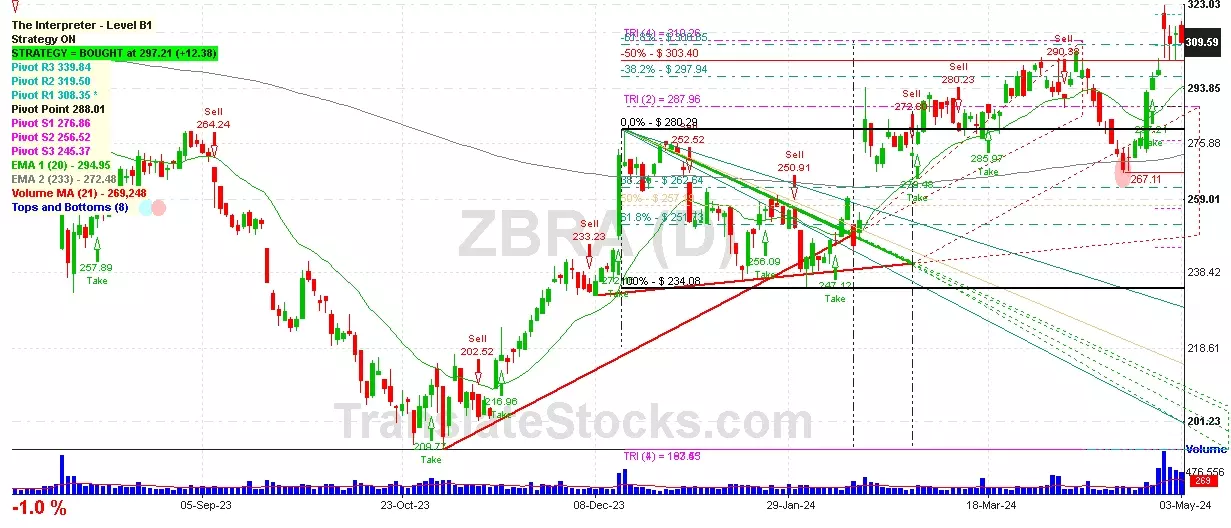
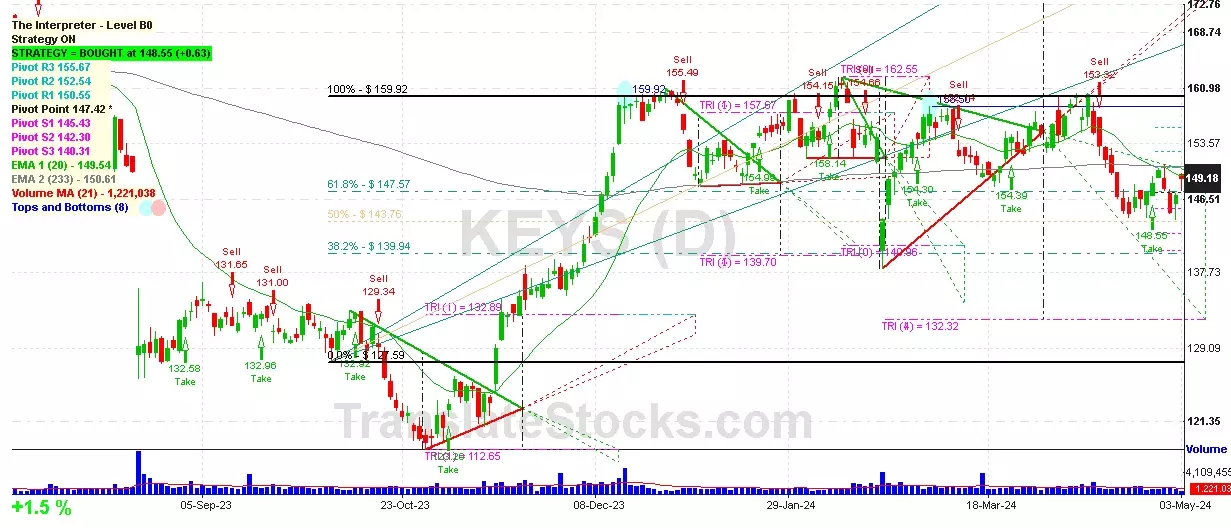 Click to Enlarge
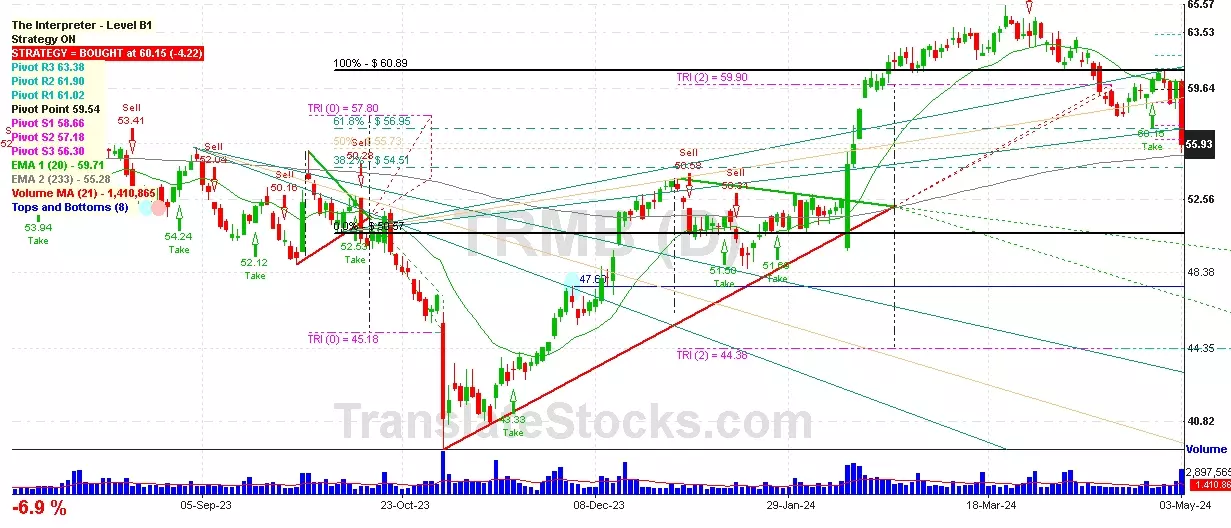