| Date | Price $ | Result % | Candle Name | Side |
|---|---|---|---|---|
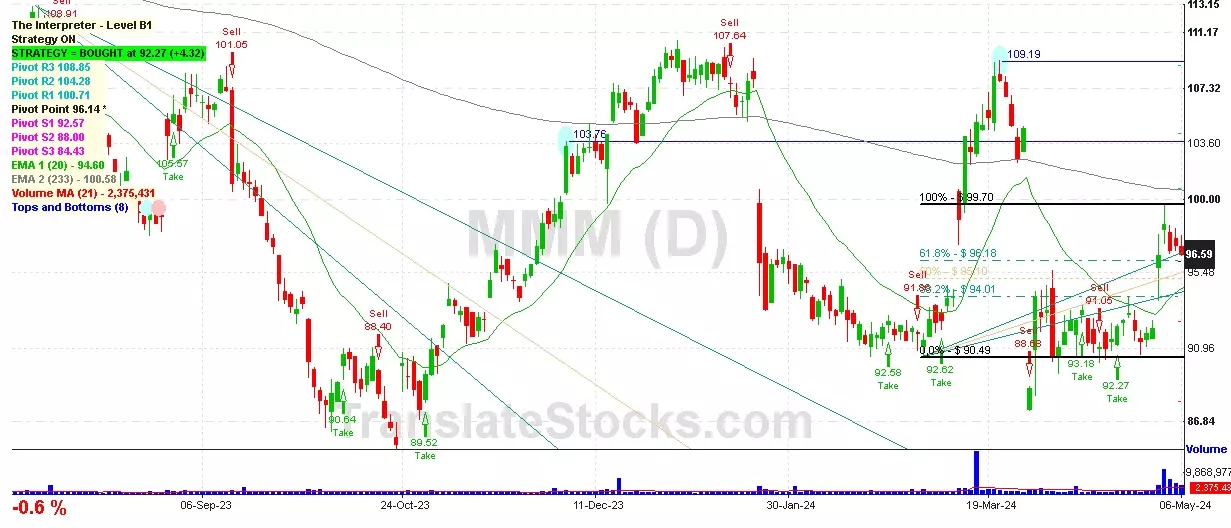
| 001 02 May 2024 | Sell Price: 96.81 | Profit: Close Day2 ($ 96.59) | Abandoned Baby | Sell |
| 002 01 Apr 2024 | Sell Price: 94.02 | Profit: Open Day1 ($ 93.10) | Abandoned Baby | Sell |
| 003 05 Mar 2024 | Buy Price: 92.69 | Profit: Open Day1 ($ 93.49) | Abandoned Baby | Buy |
| 004 26 Feb 2024 | Sell Price: 91.82 | Profit: Close Day2 ($ 91.46) | Abandoned Baby | Sell |
| 005 05 Sep 2023 | Sell Price: 106.85 | Profit: Open Day1 ($ 106.52) | Abandoned Baby | Sell |
| 006 20 Jun 2023 | Sell Price: 102.30 | Profit: Open Day1 ($ 101.67) | Abandoned Baby | Sell |
| 007One Year Average | Both Sides Result for 6 Signals |
Profit: $ 3.26 ($ 0.54 / Signal) |
All of Them | Buy + Sell |
| Simple Moving Averages (SMA) Period | Value $ | Signal | Exponential Moving Averages (EMA) Period | Value $ | Signal | |
|---|---|---|---|---|---|---|
| 2 | 96.87 | SELL | 2 | 96.76 | SELL | |
| 3 | 96.85 | SELL | 3 | 96.73 | SELL | |
| 5 | 97.10 | SELL | 5 | 96.32 | BUY | |
| 8 | 95.11 | BUY | 8 | 95.61 | BUY | |
| 13 | 94.02 | BUY | 13 | 94.92 | BUY | |
| 21 | 93.20 | BUY | 21 | 94.73 | BUY | |
| 34 | 95.52 | BUY | 34 | 95.06 | BUY | |
| 55 | 95.27 | BUY | 55 | 95.72 | BUY | |
| 90 | 97.54 | SELL | 90 | 96.56 | BUY | |
| 200 | 98.27 | SELL | 200 | 99.36 | SELL |
Common Stock
Life Sciences (
Surgical & Medical Instruments & Apparatus

 Click to Enlarge