logo
  • The Interpreter

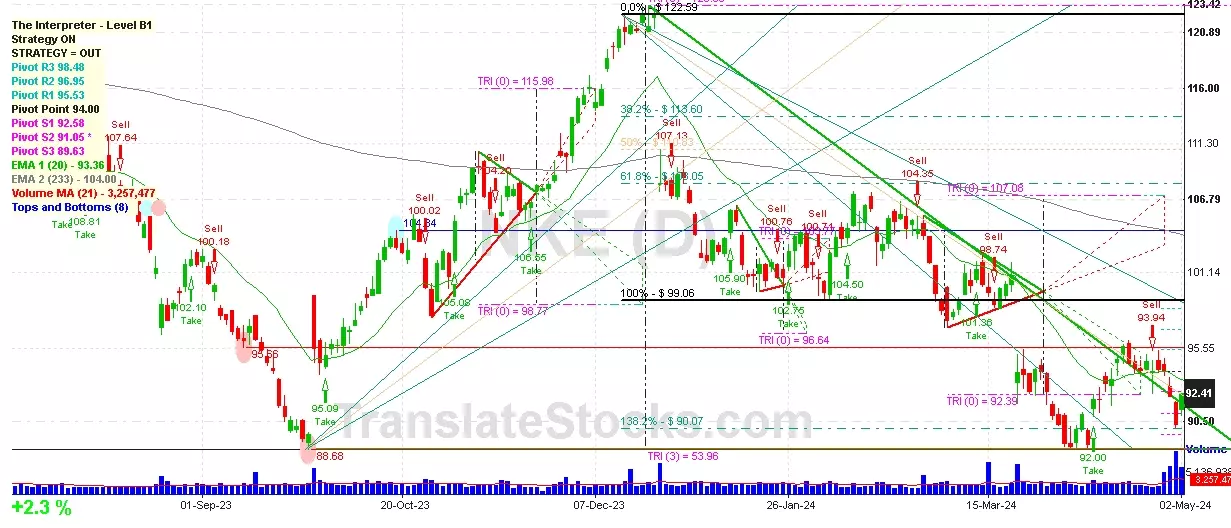
    Hey Friend, I'm analysing NIKE INC CL B (NKE), and it is between the Support of $ 92.39 (Triangle Projection Level 0) and the Resistance of $ 92.58 (PivotS1). The stock is also approaching the line of PivotS1 at $ 92.58, and if it goes above this line it could reach the next Resistance of Triangle projection at $96.64.

Nike Inc cl B (NKE)

$ 92.43 +2.3%

Last Close 02-May-24

Next Support: $ 92.39


Pivot S2: $ 91.05
Fibonacci 138.2%: $ 90.07
Triangle Level (0): $ 92.39

Next Resistance: $ 92.58


Pivot S1: $ 92.58
Fibonacci 100%: $ 99.06
Triangle Level (0): $ 96.64


    Supports and Resistances
ImageClick to Enlarge
        

Date Price $ Result % Candle Name Side
001 22 Mar 2024 Sell Price: 93.86 Profit: Close Day1 ($ 93.75) Abandoned Baby Sell
002 19 Mar 2024 Buy Price: 99.96 Profit: Close Day1 ($ 100.27) Engulfing Buy
003 14 Mar 2024 Sell Price: 100.26 Profit: Close Day1 ($ 99.64) Engulfing Sell
004 22 Dec 2023 Sell Price: 108.04 Profit: Close Day1 ($ 108.02) Abandoned Baby Sell
005 05 Jun 2023 Sell Price: 105.20 Loss: Close Day2 ($ 107.09) Engulfing Sell
006One Year Average Both Sides Result for 5 Signals Loss: $ -0.83 ($ -0.17 / Signal)
-0.8% Gross in 1 Year
All of Them Buy + Sell

Trading Rules for Candlesticks Patterns.
  1. Buy or Sell on the same day of the signal, during the after-hours trading session.
  2. Watch the Opening and Closing of the next 2 days (4 in total).
  3. Immediately exit the Trade when one of them (Open or Close, Day 1 or 2) gives you a profit.
  4. The table above will show the first Profit opportunity, but not in real-time. Therefore, you must watch the market in real-time with your broker.
Remember: The returns an asset made in the past don't mean that future returns will be the same.

Find The Lastest Buy Signals for NKE Below.


Please Subscribe to See
The Latest Trade Signals


Bought Moving Averages

Sold Moving Averages

Simple Moving Averages (SMA) Period Value $ Signal   Exponential Moving Averages (EMA) Period Value $ Signal
291.38 BUY   292.00 BUY
391.67 BUY   392.09 BUY
592.64 SELL   592.44 SELL
893.22 SELL   892.79 SELL
1393.73 SELL   1393.03 SELL
2192.55 SELL   2193.42 SELL
3493.68 SELL   3494.46 SELL
5597.01 SELL   5596.29 SELL
9099.59 SELL   9098.59 SELL
200102.46 SELL   200102.79 SELL

Latest News +


Name & IPO

Nike Inc -cl B
IPO: 1990-10-17

Stock Ticker & Exchange

Ticker: NKEIndices: Dow 30, S&P 500,
Exchange: New York Stock Exchange, Inc. (US - USD)

Contact

Website: https://about.nike.com/
Phone:

Stock Type

Common Stock

SIC Office

Manufacturing ()

Industry

Rubber & Plastics Footwear

EIN

Fiscal Year End

State of Inc.


in USD millions (if not decimal) - Dictionary

in USD millions (if not decimal) - Dictionary

Statements sources
The financial statements are based on the company's filings with the The U.S. Securities and Exchange Commission (SEC) through the Electronic Data Gathering, Analysis, and Retrieval system (EDGAR). The information is derived from the 10-K and 10-Q reports submitted to the SEC in XBRL (eXtensible Business Reporting Language) format and presented according to the US GAAP Taxonomy. Please review the original filings for a more detailed information.

SEC Filings (click for details)   SEC Filings Web Page for Nike Inc cl B

Stock Peers for NKE

Settings
Color Scheme

Left Sidebar