
| Date | Price $ | Result % | Candle Name | Side |
|---|---|---|---|---|
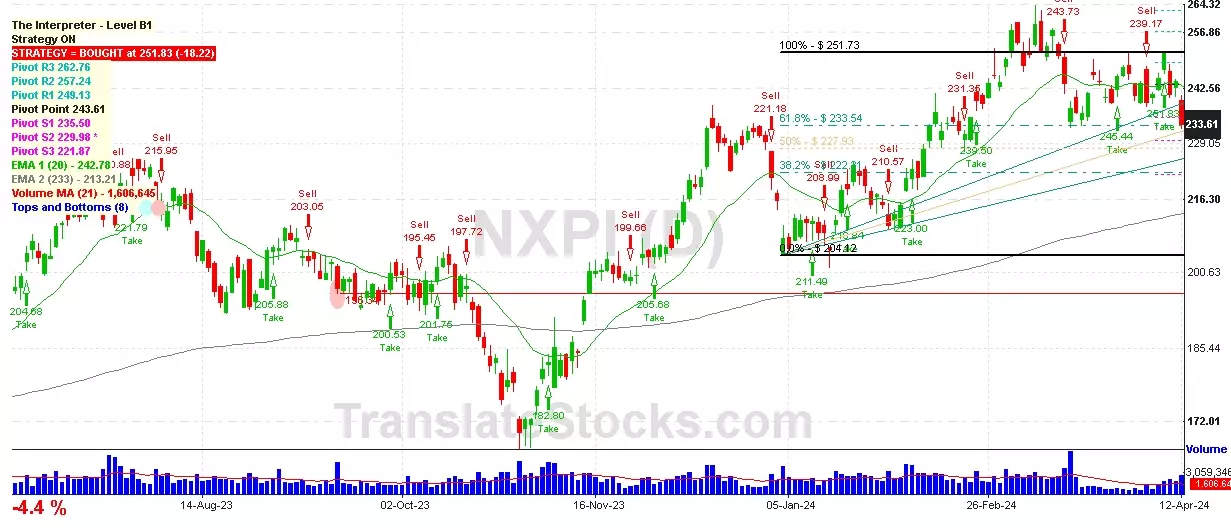
| 001 04 Mar 2024 | Sell Price: 254.30 | Profit: Open Day1 ($ 251.71) | Dark Cloud Cover | Sell |
| 002 11 Jan 2024 | Buy Price: 211.49 | Loss: Close Day2 ($ 208.99) | Piercing Line | Buy |
| 003 01 Dec 2023 | Buy Price: 205.68 | Profit: Close Day1 ($ 206.28) | Engulfing | Buy |
| 004 06 Jul 2023 | Buy Price: 204.37 | Profit: Open Day2 ($ 206.15) | Piercing Line | Buy |
| 005 31 May 2023 | Sell Price: 179.10 | Loss: Close Day2 ($ 181.60) | Abandoned Baby | Sell |
| 006 25 May 2023 | Buy Price: 171.34 | Profit: Open Day1 ($ 173.96) | Engulfing | Buy |
| 007One Year Average | Both Sides Result for 6 Signals |
Profit: $ 2.59 ($ 0.43 / Signal) |
All of Them | Buy + Sell |
| Simple Moving Averages (SMA) Period | Value $ | Signal | Exponential Moving Averages (EMA) Period | Value $ | Signal | |
|---|---|---|---|---|---|---|
| 2 | 240.39 | BUY | 2 | 240.38 | BUY | |
| 3 | 238.61 | BUY | 3 | 238.05 | BUY | |
| 5 | 232.02 | BUY | 5 | 234.77 | BUY | |
| 8 | 227.69 | BUY | 8 | 232.91 | BUY | |
| 13 | 230.87 | BUY | 13 | 233.04 | BUY | |
| 21 | 236.04 | BUY | 21 | 234.62 | BUY | |
| 34 | 239.10 | BUY | 34 | 235.91 | BUY | |
| 55 | 240.20 | BUY | 55 | 234.84 | BUY | |
| 90 | 231.80 | BUY | 90 | 230.37 | BUY | |
| 200 | 215.33 | BUY | 200 | 217.25 | BUY |
Nxp Semiconductors Nv
IPO: 2010-08-06
Ticker: NXPIIndices: S&P 500,
Nasdaq 100,
Exchange: Nasdaq Nms - Global Market (NL - USD)
Website: https://www.nxp.com/
Phone:
Common Stock
Manufacturing (
Semiconductors & Related Devices

 Click to Enlarge