| Date | Price $ | Result % | Candle Name | Side |
|---|---|---|---|---|
| 001 20 Feb 2024 | Sell Price: 129.16 | Profit: Open Day1 ($ 128.62) | Abandoned Baby | Sell |
| 002 18 Jan 2024 | Buy Price: 117.90 | Profit: Open Day1 ($ 117.92) | Abandoned Baby | Buy |
| 003 08 Jan 2024 | Buy Price: 120.76 | Profit: Close Day1 ($ 120.90) | Abandoned Baby | Buy |
| 004 22 Dec 2023 | Sell Price: 120.98 | Loss: Close Day2 ($ 123.09) | Abandoned Baby | Sell |
| 005 23 Oct 2023 | Buy Price: 73.71 | Profit: Open Day1 ($ 76.35) | Engulfing | Buy |
| 006 23 Oct 2023 | Buy Price: 73.57 | Profit: Open Day1 ($ 76.35) | Piercing Line | Buy |
| 007 25 Sep 2023 | Buy Price: 75.85 | Loss: Close Day2 ($ 73.52) | Engulfing | Buy |
| 008 25 Sep 2023 | Buy Price: 76.17 | Loss: Close Day2 ($ 73.52) | Piercing Line | Buy |
| 009 12 Sep 2023 | Buy Price: 79.38 | Profit: Open Day2 ($ 79.60) | Piercing Line | Buy |
| 010 18 Aug 2023 | Buy Price: 82.34 | Profit: Open Day1 ($ 82.65) | Engulfing | Buy |
| 011 18 Aug 2023 | Buy Price: 82.27 | Profit: Open Day1 ($ 82.65) | Piercing Line | Buy |
| 012 14 Jul 2023 | Sell Price: 88.20 | Profit: Open Day1 ($ 86.83) | Engulfing | Sell |
| 013 26 Jun 2023 | Buy Price: 81.26 | Profit: Close Day1 ($ 83.28) | Abandoned Baby | Buy |
| 014 15 Jun 2023 | Sell Price: 84.18 | Profit: Open Day2 ($ 83.68) | Abandoned Baby | Sell |
| 015 24 May 2023 | Buy Price: 85.51 | Profit: Open Day1 ($ 87.47) | Engulfing | Buy |
| 016One Year Average | Both Sides Result for 15 Signals |
Profit: $ 5.79 ($ 0.39 / Signal) |
All of Them | Buy + Sell |
| Simple Moving Averages (SMA) Period | Value $ | Signal | Exponential Moving Averages (EMA) Period | Value $ | Signal | |
|---|---|---|---|---|---|---|
| 2 | 114.07 | SELL | 2 | 113.65 | SELL | |
| 3 | 113.79 | SELL | 3 | 113.37 | BUY | |
| 5 | 112.32 | BUY | 5 | 112.80 | BUY | |
| 8 | 111.79 | BUY | 8 | 112.18 | BUY | |
| 13 | 111.31 | BUY | 13 | 111.86 | BUY | |
| 21 | 109.87 | BUY | 21 | 112.80 | BUY | |
| 34 | 116.09 | SELL | 34 | 115.17 | SELL | |
| 55 | 122.94 | SELL | 55 | 117.17 | SELL | |
| 90 | 122.64 | SELL | 90 | 116.13 | SELL | |
| 200 | 102.11 | BUY | 200 | 106.84 | BUY |
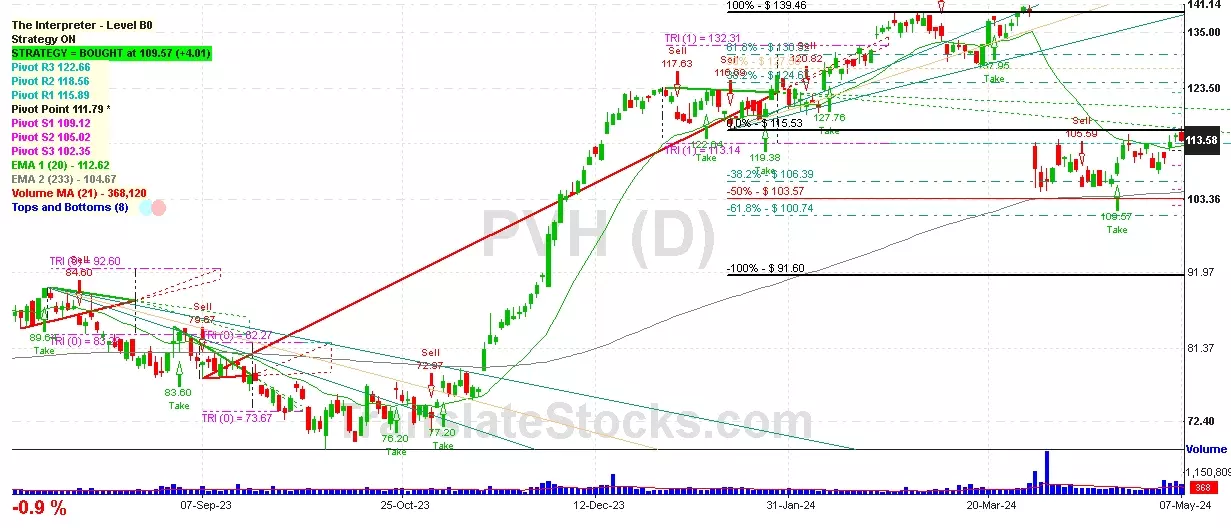
Pvh Corp
IPO: 1920-03-25
Ticker: PVHIndices: S&P 500,
Exchange: New York Stock Exchange, Inc. (US - USD)
Website: https://www.pvh.com/
Phone:
Common Stock
Manufacturing (
Men's & Boys' Furnishgs, Work Clothg, & Allied Garments

 Click to Enlarge