| Date | Price $ | Result % | Candle Name | Side |
|---|---|---|---|---|
| 001 22 Apr 2024 | Sell Price: 167.11 | Profit: Close Day1 ($ 166.51) | Engulfing | Sell |
| 002 22 Apr 2024 | Sell Price: 167.37 | Profit: Close Day1 ($ 166.51) | Dark Cloud Cover | Sell |
| 003 04 Mar 2024 | Sell Price: 150.49 | Loss: Close Day2 ($ 173.54) | Abandoned Baby | Sell |
| 004 26 Feb 2024 | Sell Price: 150.15 | Loss: Close Day2 ($ 151.44) | Abandoned Baby | Sell |
| 005 21 Feb 2024 | Sell Price: 148.79 | Loss: Close Day2 ($ 151.48) | Abandoned Baby | Sell |
| 006 11 Jan 2024 | Sell Price: 142.02 | Profit: Close Day1 ($ 140.91) | Engulfing | Sell |
| 007 12 Dec 2023 | Sell Price: 135.66 | Loss: Close Day2 ($ 141.14) | Engulfing | Sell |
| 008 12 Jul 2023 | Sell Price: 132.91 | Profit: Close Day1 ($ 132.82) | Dark Cloud Cover | Sell |
| 009 21 Jun 2023 | Buy Price: 133.22 | Profit: Open Day1 ($ 133.44) | Engulfing | Buy |
| 010 17 May 2023 | Buy Price: 160.96 | Loss: Close Day2 ($ 152.28) | Engulfing | Buy |
| 011One Year Average | Both Sides Result for 10 Signals |
Loss: $ -38.31 ($ -3.83 / Signal) |
All of Them | Buy + Sell |
| Simple Moving Averages (SMA) Period | Value $ | Signal | Exponential Moving Averages (EMA) Period | Value $ | Signal | |
|---|---|---|---|---|---|---|
| 2 | 157.28 | BUY | 2 | 158.18 | SELL | |
| 3 | 158.51 | SELL | 3 | 158.84 | SELL | |
| 5 | 160.80 | SELL | 5 | 160.15 | SELL | |
| 8 | 162.54 | SELL | 8 | 161.65 | SELL | |
| 13 | 163.85 | SELL | 13 | 163.36 | SELL | |
| 21 | 166.17 | SELL | 21 | 164.78 | SELL | |
| 34 | 168.40 | SELL | 34 | 164.73 | SELL | |
| 55 | 164.17 | SELL | 55 | 161.99 | SELL | |
| 90 | 155.64 | BUY | 90 | 156.43 | BUY | |
| 200 | 137.68 | BUY | 200 | 148.40 | BUY |
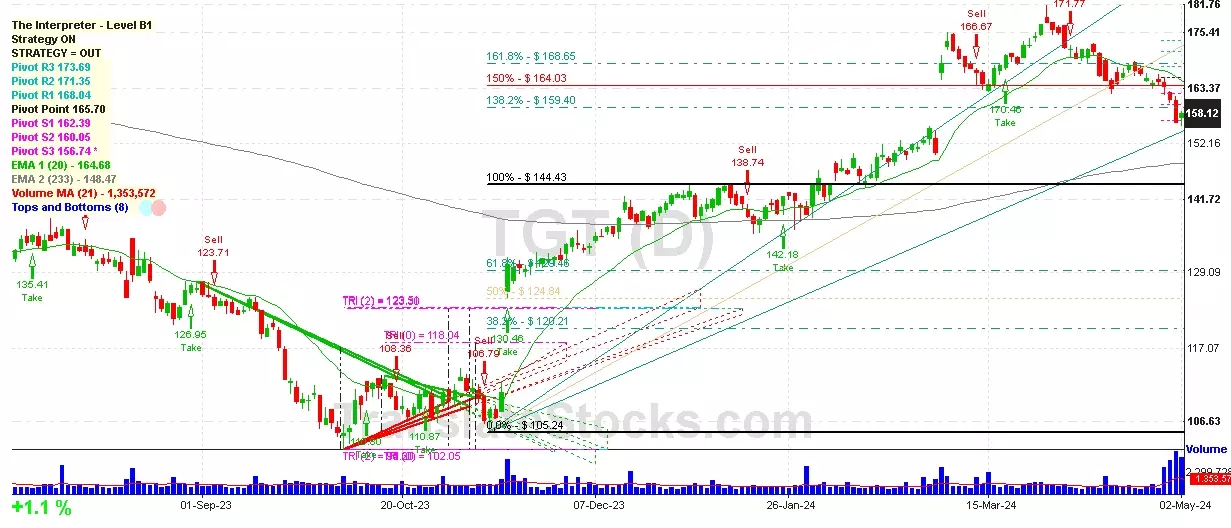
Target Corp
IPO: 1969-09-08
Ticker: TGTIndices: S&P 500,
Exchange: New York Stock Exchange, Inc. (US - USD)
Website: https://corporate.target.com/
Phone:
Common Stock
Trade & Services (
Retail-variety Stores

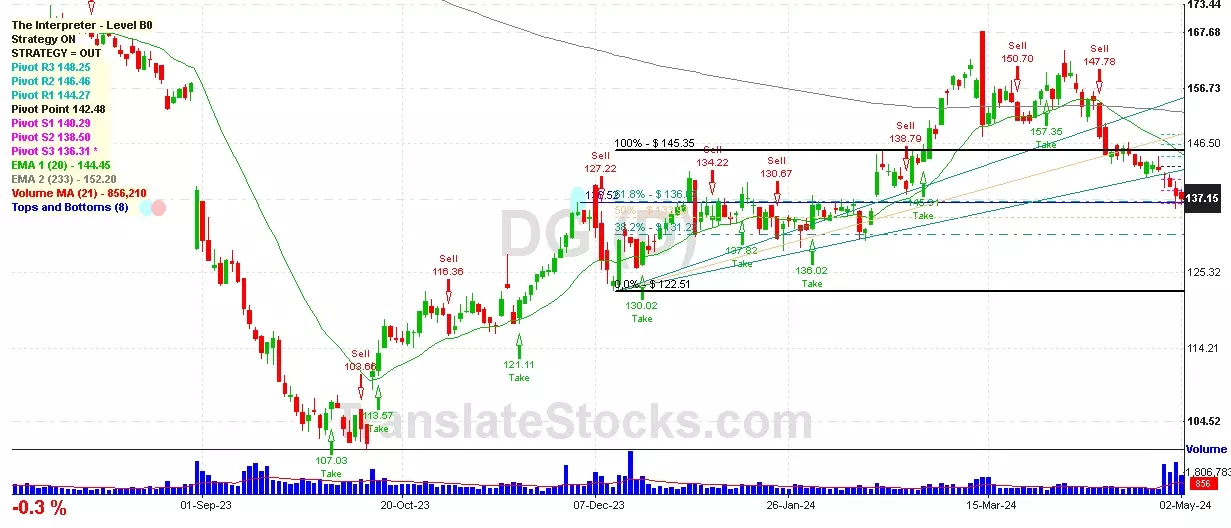
 Click to Enlarge
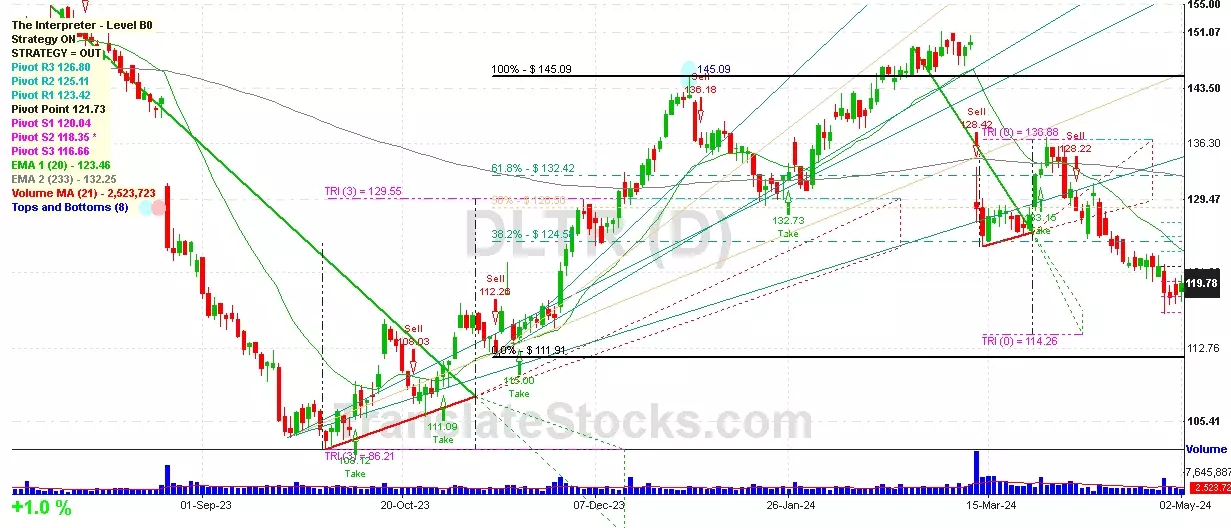