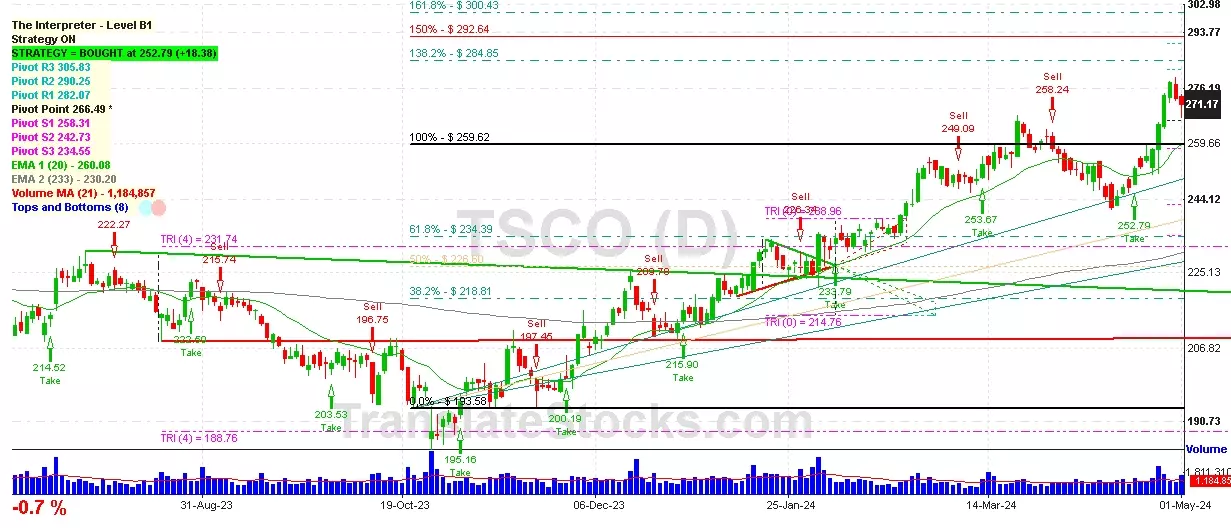
Hey Friend, I'm analysing TRACTOR SUPPLY COMPANY (TSCO), and it is between the Support of $ 266.49 (Pivot) and the Resistance of $ 282.07 (PivotR1). The stock is also approaching the line of Pivot at $ 266.49, and if it goes below this line it could reach the next Support of 100% of Fibonacci at $ 259.62.

| Date | Price $ | Result % | Candle Name | Side |
|---|---|---|---|---|
| 001 01 Apr 2024 | Sell Price: 258.24 | Profit: Open Day1 ($ 258.00) | Abandoned Baby | Sell |
| 002 04 Mar 2024 | Buy Price: 253.26 | Loss: Close Day2 ($ 250.66) | Piercing Line | Buy |
| 003 22 Feb 2024 | Buy Price: 239.71 | Profit: Open Day1 ($ 239.94) | Engulfing | Buy |
| 004 16 Feb 2024 | Sell Price: 236.49 | Profit: Open Day1 ($ 235.21) | Abandoned Baby | Sell |
| 005 23 Jan 2024 | Sell Price: 228.40 | Profit: Close Day1 ($ 226.03) | Abandoned Baby | Sell |
| 006 16 Nov 2023 | Sell Price: 203.06 | Profit: Close Day1 ($ 202.61) | Abandoned Baby | Sell |
| 007 10 Oct 2023 | Buy Price: 205.03 | Profit: Open Day1 ($ 205.34) | Engulfing | Buy |
| 008 07 Sep 2023 | Buy Price: 219.00 | Loss: Close Day2 ($ 217.68) | Abandoned Baby | Buy |
| 009 24 Jul 2023 | Sell Price: 214.66 | Profit: Open Day1 ($ 210.17) | Dark Cloud Cover | Sell |
| 010 13 Jun 2023 | Sell Price: 217.26 | Loss: Close Day2 ($ 220.70) | Engulfing | Sell |
| 011 13 Jun 2023 | Sell Price: 217.49 | Loss: Close Day2 ($ 220.70) | Dark Cloud Cover | Sell |
| 012 06 Jun 2023 | Buy Price: 216.86 | Profit: Close Day1 ($ 217.81) | Engulfing | Buy |
| 013 30 May 2023 | Buy Price: 215.35 | Loss: Close Day2 ($ 206.32) | Abandoned Baby | Buy |
| 014One Year Average | Both Sides Result for 13 Signals |
Loss: $ -9.28 ($ -0.71 / Signal) |
All of Them | Buy + Sell |
| Simple Moving Averages (SMA) Period | Value $ | Signal | Exponential Moving Averages (EMA) Period | Value $ | Signal | |
|---|---|---|---|---|---|---|
| 2 | 272.13 | SELL | 2 | 272.05 | SELL | |
| 3 | 274.04 | SELL | 3 | 272.00 | SELL | |
| 5 | 272.26 | SELL | 5 | 270.23 | BUY | |
| 8 | 266.10 | BUY | 8 | 266.98 | BUY | |
| 13 | 258.70 | BUY | 13 | 263.11 | BUY | |
| 21 | 255.78 | BUY | 21 | 259.76 | BUY | |
| 34 | 256.90 | BUY | 34 | 256.28 | BUY | |
| 55 | 252.53 | BUY | 55 | 251.16 | BUY | |
| 90 | 241.57 | BUY | 90 | 243.81 | BUY | |
| 200 | 223.97 | BUY | 200 | 231.97 | BUY |
Tractor Supply Company
IPO: 1994-02-17
Ticker: TSCOIndices: S&P 500,
Exchange: Nasdaq Nms - Global Market (US - USD)
Website: https://www.tractorsupply.com/
Phone:
Common Stock
Trade & Services (
Retail-building Materials, Hardware, Garden Supply
 Click to Enlarge