| Date | Price $ | Result % | Candle Name | Side |
|---|---|---|---|---|
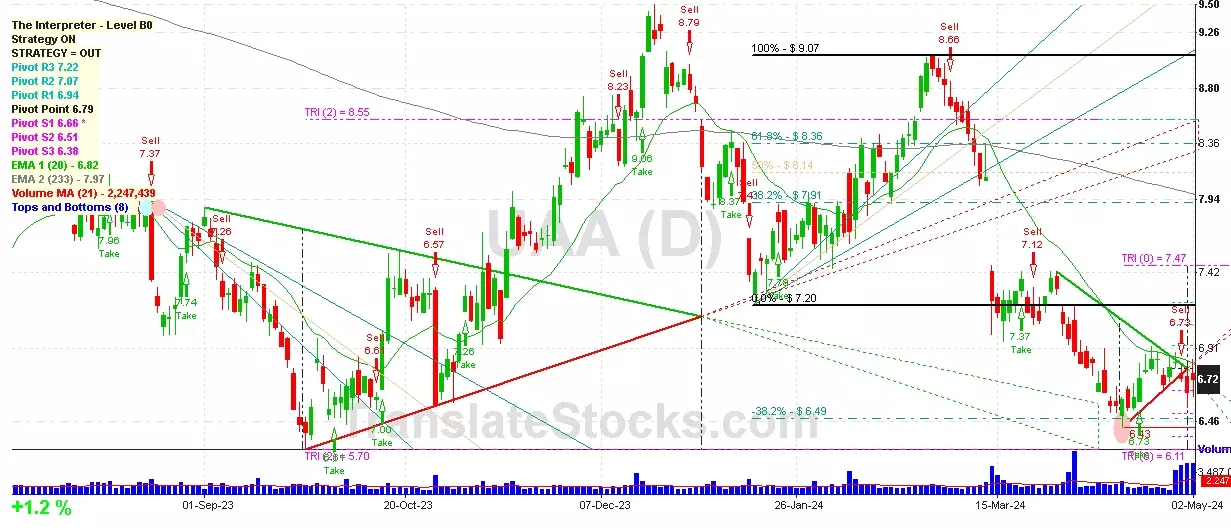
| 001 29 Feb 2024 | Sell Price: 8.54 | Profit: Close Day1 ($ 8.50) | Dark Cloud Cover | Sell |
| 002 20 Feb 2024 | Buy Price: 7.85 | Profit: Close Day1 ($ 8.00) | Piercing Line | Buy |
| 003 20 Oct 2023 | Sell Price: 6.76 | Profit: Open Day1 ($ 6.70) | Engulfing | Sell |
| 004 28 Sep 2023 | Buy Price: 6.10 | Profit: Open Day1 ($ 6.27) | Engulfing | Buy |
| 005 17 Aug 2023 | Sell Price: 7.05 | Profit: Open Day1 ($ 6.95) | Engulfing | Sell |
| 006 17 Aug 2023 | Sell Price: 7.07 | Profit: Open Day1 ($ 6.95) | Dark Cloud Cover | Sell |
| 007 16 Aug 2023 | Buy Price: 7.13 | Profit: Open Day1 ($ 7.17) | Abandoned Baby | Buy |
| 008 14 Aug 2023 | Buy Price: 7.17 | Loss: Close Day2 ($ 7.13) | Engulfing | Buy |
| 009 14 Aug 2023 | Buy Price: 7.18 | Loss: Close Day2 ($ 7.13) | Piercing Line | Buy |
| 010 20 Jun 2023 | Sell Price: 6.92 | Profit: Open Day1 ($ 6.89) | Abandoned Baby | Sell |
| 011One Year Average | Both Sides Result for 10 Signals |
Profit: $ 0.62 ($ 0.06 / Signal) |
All of Them | Buy + Sell |
| Simple Moving Averages (SMA) Period | Value $ | Signal | Exponential Moving Averages (EMA) Period | Value $ | Signal | |
|---|---|---|---|---|---|---|
| 2 | 6.48 | BUY | 2 | 6.50 | BUY | |
| 3 | 6.49 | BUY | 3 | 6.51 | BUY | |
| 5 | 6.52 | SELL | 5 | 6.51 | BUY | |
| 8 | 6.54 | SELL | 8 | 6.51 | BUY | |
| 13 | 6.49 | BUY | 13 | 6.52 | SELL | |
| 21 | 6.48 | BUY | 21 | 6.59 | SELL | |
| 34 | 6.65 | SELL | 34 | 6.75 | SELL | |
| 55 | 7.18 | SELL | 55 | 6.96 | SELL | |
| 90 | 7.38 | SELL | 90 | 7.13 | SELL | |
| 200 | 7.18 | SELL | 200 | 7.35 | SELL |
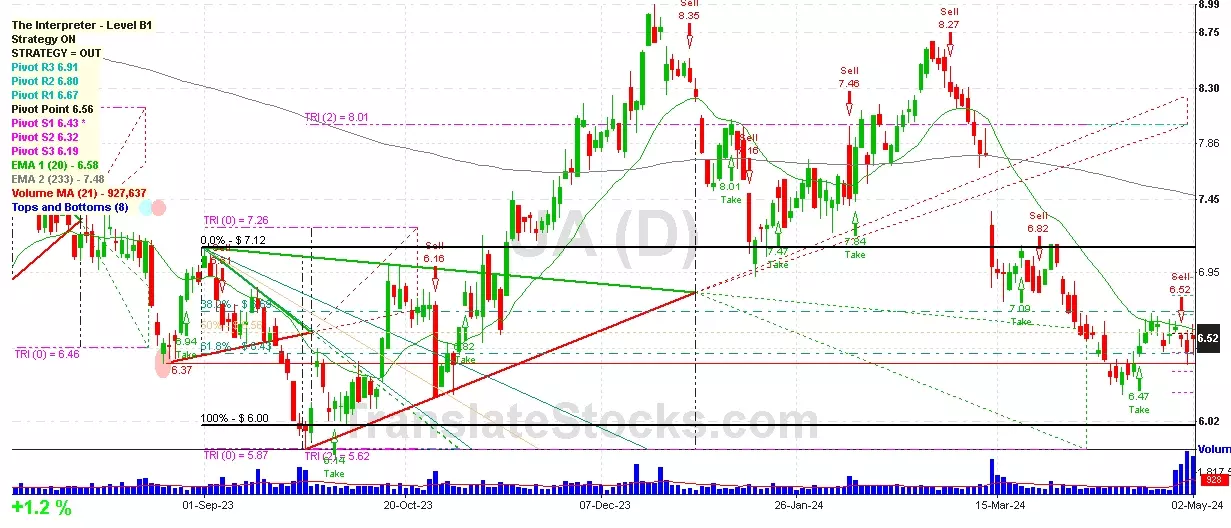
Under Armour Inc-class C
IPO: 2005-11-18
Ticker: UAIndices: S&P 500,
Exchange: New York Stock Exchange, Inc. (US - USD)
Website: https://www.underarmour.com/
Phone:
Common Stock
Manufacturing (
Apparel & Other Finishd Prods Of Fabrics & Similar Matl

 Click to Enlarge