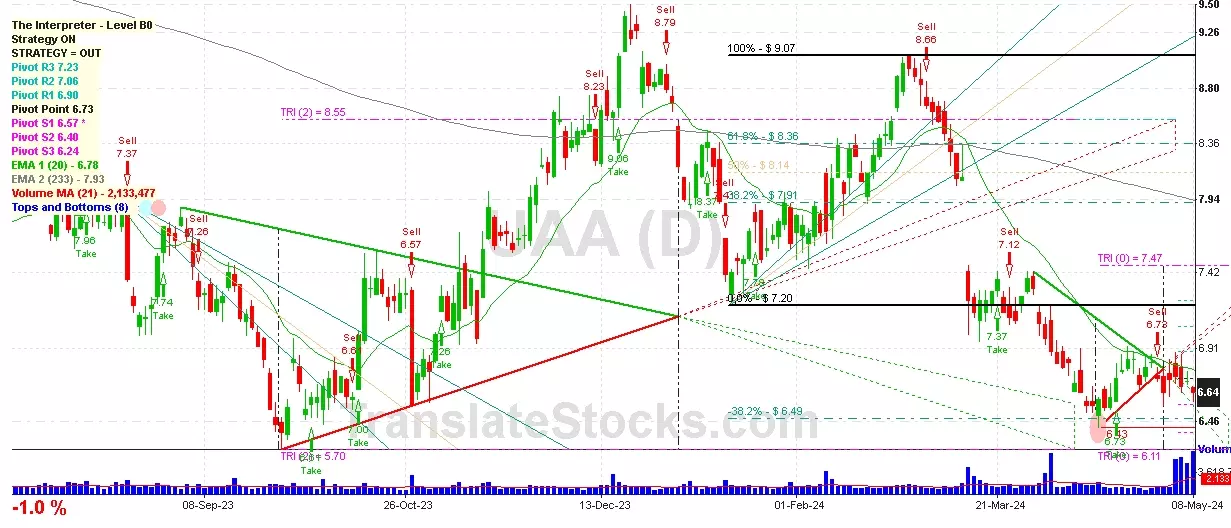
Hey Friend, I'm analysing UNDER ARMOUR INC CLASS A (UAA), and it is between the Support of $ 6.57 (PivotS1) and the Resistance of $ 6.73 (Pivot). The stock is also approaching the line of PivotS1 at $ 6.57, and if it goes below this line it could reach the next Support of -38.2% of Fibonacci at $ 6.49.

| Date | Price $ | Result % | Candle Name | Side |
|---|---|---|---|---|
| 001 20 Feb 2024 | Buy Price: 8.14 | Profit: Close Day1 ($ 8.27) | Engulfing | Buy |
| 002 20 Feb 2024 | Buy Price: 8.13 | Profit: Open Day1 ($ 8.14) | Piercing Line | Buy |
| 003 22 Nov 2023 | Buy Price: 7.66 | Profit: Open Day1 ($ 7.68) | Abandoned Baby | Buy |
| 004 07 Nov 2023 | Buy Price: 7.21 | Profit: Close Day1 ($ 7.42) | Piercing Line | Buy |
| 005 10 Oct 2023 | Sell Price: 6.60 | Loss: Close Day2 ($ 6.62) | Engulfing | Sell |
| 006 10 Oct 2023 | Sell Price: 6.63 | Profit: Close Day2 ($ 6.62) | Dark Cloud Cover | Sell |
| 007 21 Aug 2023 | Sell Price: 7.37 | Profit: Open Day1 ($ 7.29) | Engulfing | Sell |
| 008 20 Jun 2023 | Sell Price: 7.53 | Profit: Open Day1 ($ 7.46) | Abandoned Baby | Sell |
| 009 15 May 2023 | Buy Price: 7.67 | Loss: Close Day2 ($ 7.42) | Engulfing | Buy |
| 010 15 May 2023 | Buy Price: 7.66 | Loss: Close Day2 ($ 7.42) | Piercing Line | Buy |
| 011One Year Average | Both Sides Result for 10 Signals |
Profit: $ 0.02 ($ 0.00 / Signal) |
All of Them | Buy + Sell |
| Simple Moving Averages (SMA) Period | Value $ | Signal | Exponential Moving Averages (EMA) Period | Value $ | Signal | |
|---|---|---|---|---|---|---|
| 2 | 6.70 | BUY | 2 | 6.71 | BUY | |
| 3 | 6.71 | SELL | 3 | 6.71 | BUY | |
| 5 | 6.70 | BUY | 5 | 6.71 | SELL | |
| 8 | 6.73 | SELL | 8 | 6.72 | SELL | |
| 13 | 6.75 | SELL | 13 | 6.74 | SELL | |
| 21 | 6.70 | BUY | 21 | 6.80 | SELL | |
| 34 | 6.86 | SELL | 34 | 6.96 | SELL | |
| 55 | 7.40 | SELL | 55 | 7.18 | SELL | |
| 90 | 7.62 | SELL | 90 | 7.39 | SELL | |
| 200 | 7.59 | SELL | 200 | 7.76 | SELL |
Under Armour Inc-class A
IPO: 2005-11-18
Ticker: UAAIndices: S&P 500,
Exchange: New York Stock Exchange, Inc. (US - USD)
Website: https://www.underarmour.com/
Phone:
Common Stock
Manufacturing (
Apparel & Other Finishd Prods Of Fabrics & Similar Matl
 Click to Enlarge