| Date | Price $ | Result % | Candle Name | Side |
|---|---|---|---|---|
| 001 01 Apr 2024 | Sell Price: 175.21 | Profit: Open Day1 ($ 174.43) | Abandoned Baby | Sell |
| 002 20 Feb 2024 | Buy Price: 162.43 | Profit: Close Day1 ($ 163.30) | Piercing Line | Buy |
| 003 07 Feb 2024 | Buy Price: 162.45 | Loss: Close Day2 ($ 162.38) | Abandoned Baby | Buy |
| 004 01 Feb 2024 | Buy Price: 163.14 | Loss: Close Day2 ($ 162.67) | Engulfing | Buy |
| 005 16 Jan 2024 | Sell Price: 157.95 | Profit: Open Day1 ($ 156.54) | Abandoned Baby | Sell |
| 006 20 Dec 2023 | Sell Price: 148.42 | Loss: Close Day2 ($ 153.08) | Abandoned Baby | Sell |
| 007 20 Dec 2023 | Sell Price: 148.08 | Loss: Close Day2 ($ 153.08) | Engulfing | Sell |
| 008 27 Nov 2023 | Sell Price: 137.23 | Profit: Close Day1 ($ 136.08) | Abandoned Baby | Sell |
| 009 08 Nov 2023 | Sell Price: 129.62 | Profit: Close Day1 ($ 128.26) | Dark Cloud Cover | Sell |
| 010 07 Sep 2023 | Buy Price: 128.10 | Profit: Open Day1 ($ 128.36) | Piercing Line | Buy |
| 011 18 Aug 2023 | Buy Price: 128.56 | Profit: Open Day1 ($ 128.73) | Piercing Line | Buy |
| 012 13 Jun 2023 | Buy Price: 140.97 | Profit: Open Day1 ($ 145.74) | Abandoned Baby | Buy |
| 013 19 May 2023 | Sell Price: 134.63 | Profit: Open Day2 ($ 134.23) | Dark Cloud Cover | Sell |
| 014 18 May 2023 | Buy Price: 135.84 | Profit: Open Day1 ($ 136.70) | Engulfing | Buy |
| 015 05 May 2023 | Buy Price: 142.80 | Profit: Close Day1 ($ 143.19) | Abandoned Baby | Buy |
| 016One Year Average | Both Sides Result for 15 Signals |
Profit: $ 2.21 ($ 0.15 / Signal) |
All of Them | Buy + Sell |
| Simple Moving Averages (SMA) Period | Value $ | Signal | Exponential Moving Averages (EMA) Period | Value $ | Signal | |
|---|---|---|---|---|---|---|
| 2 | 165.58 | BUY | 2 | 165.73 | BUY | |
| 3 | 165.69 | BUY | 3 | 165.31 | BUY | |
| 5 | 164.62 | BUY | 5 | 164.53 | BUY | |
| 8 | 161.78 | BUY | 8 | 164.22 | BUY | |
| 13 | 163.65 | BUY | 13 | 165.01 | BUY | |
| 21 | 167.63 | SELL | 21 | 166.60 | SELL | |
| 34 | 171.27 | SELL | 34 | 167.64 | SELL | |
| 55 | 169.51 | SELL | 55 | 166.56 | SELL | |
| 90 | 164.20 | BUY | 90 | 162.57 | BUY | |
| 200 | 147.10 | BUY | 200 | 152.58 | BUY |
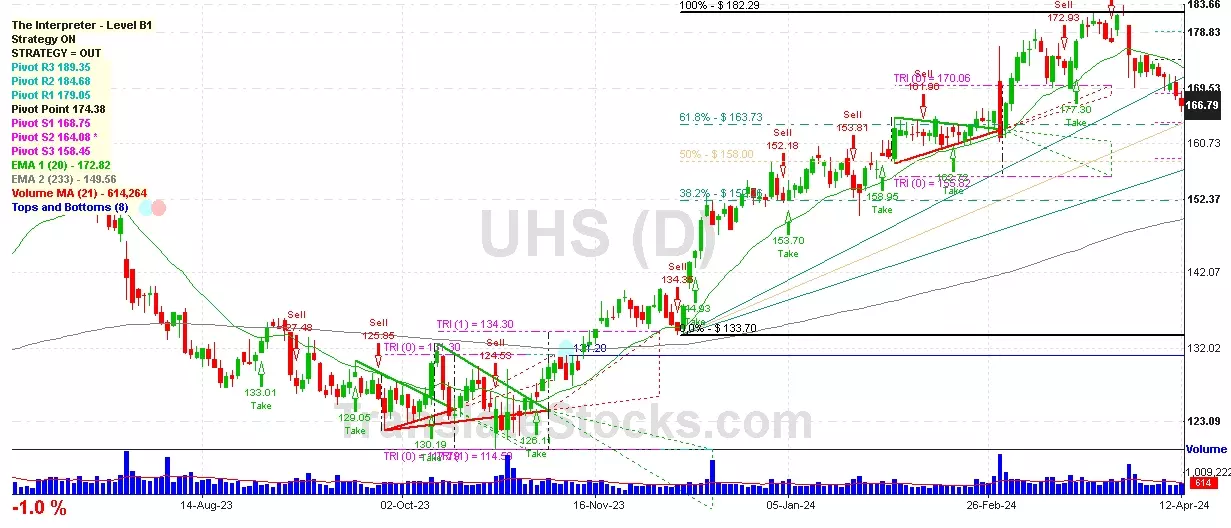
Universal Health Services-b
IPO: 1981-07-10
Ticker: UHSIndices: S&P 500,
Exchange: New York Stock Exchange, Inc. (US - USD)
Website: https://www.uhsinc.com/
Phone:
Common Stock
Life Sciences (
Services-general Medical & Surgical Hospitals, Nec

 Click to Enlarge