| Date | Price $ | Result % | Candle Name | Side |
|---|---|---|---|---|
| 001 22 Apr 2024 | Buy Price: 417.98 | Profit: Open Day1 ($ 420.86) | Abandoned Baby | Buy |
| 002 05 Mar 2024 | Buy Price: 549.46 | Profit: Open Day1 ($ 555.10) | Abandoned Baby | Buy |
| 003 02 Feb 2024 | Buy Price: 505.33 | Profit: Open Day1 ($ 506.51) | Piercing Line | Buy |
| 004 19 Jan 2024 | Sell Price: 472.38 | Loss: Close Day2 ($ 479.90) | Engulfing | Sell |
| 005 19 Jan 2024 | Sell Price: 472.57 | Loss: Close Day2 ($ 479.90) | Dark Cloud Cover | Sell |
| 006 02 Jan 2024 | Sell Price: 486.61 | Profit: Open Day1 ($ 485.18) | Abandoned Baby | Sell |
| 007 02 Nov 2023 | Buy Price: 380.32 | Profit: Open Day1 ($ 382.15) | Abandoned Baby | Buy |
| 008 04 Aug 2023 | Buy Price: 438.32 | Profit: Open Day1 ($ 439.02) | Engulfing | Buy |
| 009 04 Aug 2023 | Buy Price: 438.52 | Profit: Open Day1 ($ 439.02) | Piercing Line | Buy |
| 010 21 Jun 2023 | Buy Price: 450.19 | Profit: Close Day1 ($ 455.71) | Abandoned Baby | Buy |
| 011One Year Average | Both Sides Result for 10 Signals |
Profit: $ 4.83 ($ 0.48 / Signal) |
All of Them | Buy + Sell |
| Simple Moving Averages (SMA) Period | Value $ | Signal | Exponential Moving Averages (EMA) Period | Value $ | Signal | |
|---|---|---|---|---|---|---|
| 2 | 407.20 | SELL | 2 | 407.52 | SELL | |
| 3 | 408.32 | SELL | 3 | 408.91 | SELL | |
| 5 | 412.44 | SELL | 5 | 411.84 | SELL | |
| 8 | 415.67 | SELL | 8 | 416.89 | SELL | |
| 13 | 424.92 | SELL | 13 | 426.93 | SELL | |
| 21 | 444.59 | SELL | 21 | 443.02 | SELL | |
| 34 | 478.59 | SELL | 34 | 461.84 | SELL | |
| 55 | 502.56 | SELL | 55 | 475.51 | SELL | |
| 90 | 496.24 | SELL | 90 | 478.83 | SELL | |
| 200 | 455.45 | SELL | 200 | 470.63 | SELL |
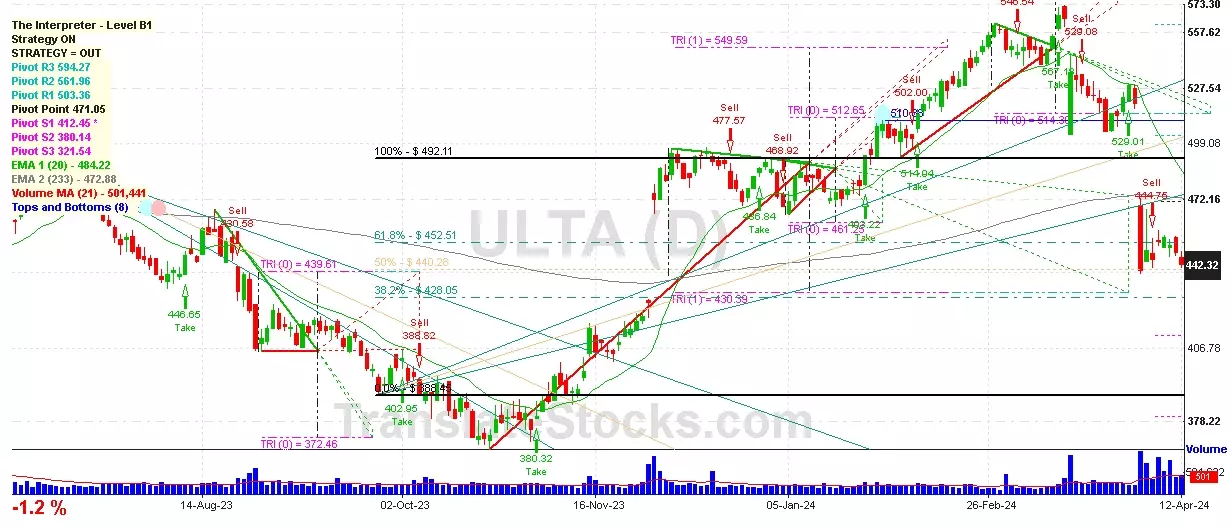
Ulta Beauty Inc
IPO: 2007-10-25
Ticker: ULTAIndices: S&P 500,
Exchange: Nasdaq Nms - Global Market (US - USD)
Website: http://www.ulta.com/
Phone:
Common Stock
Trade & Services (
Retail-retail Stores, Nec

 Click to Enlarge