| Date | Price $ | Result % | Candle Name | Side |
|---|---|---|---|---|
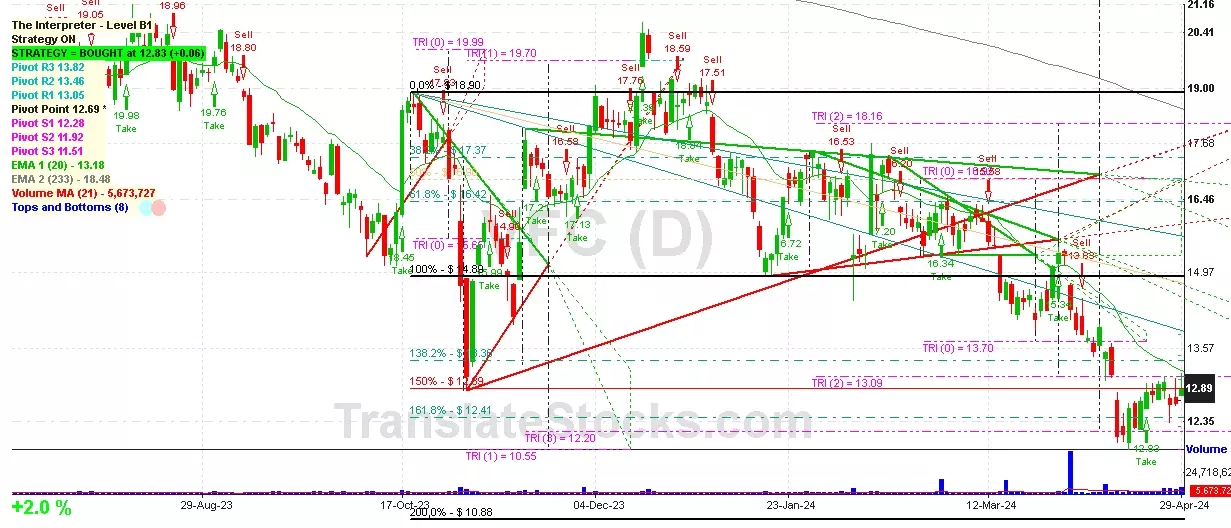
| 001 11 Mar 2024 | Sell Price: 16.00 | Profit: Open Day1 ($ 15.99) | Abandoned Baby | Sell |
| 002 01 Mar 2024 | Sell Price: 16.24 | Profit: Open Day1 ($ 16.09) | Engulfing | Sell |
| 003 05 Feb 2024 | Sell Price: 16.53 | Profit: Open Day1 ($ 16.50) | Dark Cloud Cover | Sell |
| 004 30 Aug 2023 | Sell Price: 19.38 | Loss: Close Day2 ($ 20.46) | Abandoned Baby | Sell |
| 005 07 Jul 2023 | Buy Price: 18.66 | Profit: Open Day1 ($ 18.70) | Engulfing | Buy |
| 006 07 Jul 2023 | Buy Price: 18.63 | Profit: Open Day1 ($ 18.70) | Piercing Line | Buy |
| 007 21 Jun 2023 | Sell Price: 19.13 | Profit: Close Day1 ($ 18.94) | Abandoned Baby | Sell |
| 008 09 Jun 2023 | Sell Price: 19.11 | Profit: Close Day2 ($ 19.06) | Abandoned Baby | Sell |
| 009One Year Average | Both Sides Result for 8 Signals |
Loss: $ -0.54 ($ -0.07 / Signal) |
All of Them | Buy + Sell |
| Simple Moving Averages (SMA) Period | Value $ | Signal | Exponential Moving Averages (EMA) Period | Value $ | Signal | |
|---|---|---|---|---|---|---|
| 2 | 12.77 | BUY | 2 | 12.82 | BUY | |
| 3 | 12.72 | BUY | 3 | 12.80 | BUY | |
| 5 | 12.82 | BUY | 5 | 12.78 | BUY | |
| 8 | 12.80 | BUY | 8 | 12.80 | BUY | |
| 13 | 12.66 | BUY | 13 | 12.92 | SELL | |
| 21 | 13.17 | SELL | 21 | 13.22 | SELL | |
| 34 | 13.77 | SELL | 34 | 13.72 | SELL | |
| 55 | 14.69 | SELL | 55 | 14.37 | SELL | |
| 90 | 15.65 | SELL | 90 | 15.15 | SELL | |
| 200 | 16.93 | SELL | 200 | 17.49 | SELL |
Vf Corp
IPO: 1966-07-25
Ticker: VFCIndices: S&P 500,
Exchange: New York Stock Exchange, Inc. (US - USD)
Website: https://www.vfc.com/
Phone:
Common Stock
Manufacturing (
Men's & Boys' Furnishgs, Work Clothg, & Allied Garments

 Click to Enlarge