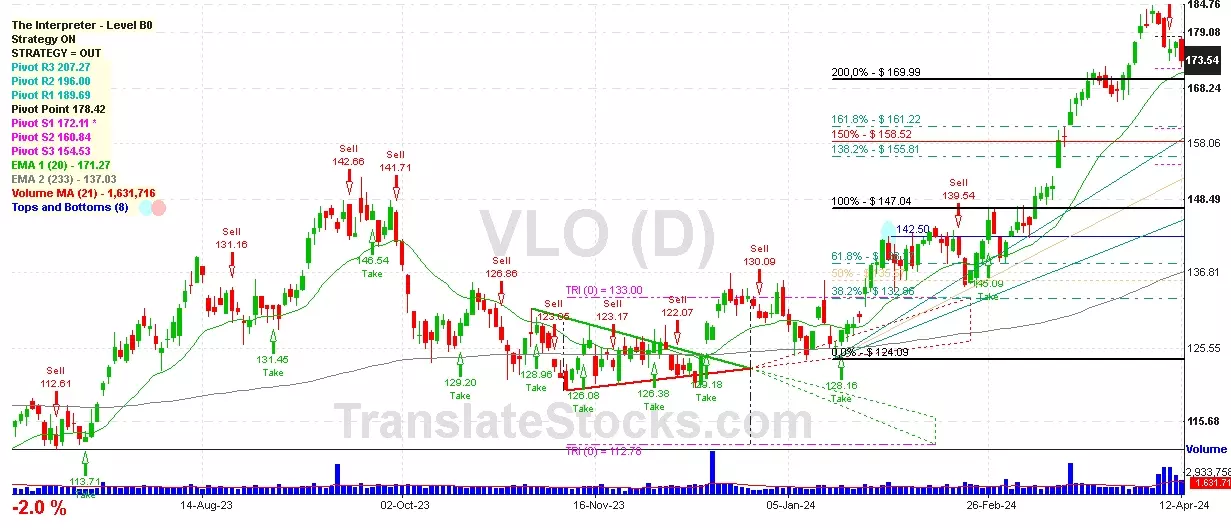
Hey Friend, I'm analysing VALERO ENERGY CORP (VLO), and it is between the Support of $ 172.11 (PivotS1) and the Resistance of $ 178.42 (Pivot). The stock is also approaching the line of PivotS1 at $ 172.11, and if it goes below this line it could reach the next Support of 200% of Fibonacci at $ 169.99.

| Date | Price $ | Result % | Candle Name | Side |
|---|---|---|---|---|
| 001 27 Feb 2024 | Sell Price: 142.98 | Profit: Open Day1 ($ 142.26) | Dark Cloud Cover | Sell |
| 002 20 Dec 2023 | Sell Price: 132.54 | Profit: Close Day1 ($ 131.92) | Dark Cloud Cover | Sell |
| 003 24 Aug 2023 | Buy Price: 129.46 | Profit: Open Day1 ($ 130.55) | Piercing Line | Buy |
| 004 26 May 2023 | Buy Price: 113.82 | Loss: Close Day2 ($ 107.04) | Abandoned Baby | Buy |
| 005 05 May 2023 | Buy Price: 107.04 | Profit: Open Day1 ($ 109.28) | Abandoned Baby | Buy |
| 006One Year Average | Both Sides Result for 5 Signals |
Loss: $ -2.11 ($ -0.42 / Signal) |
All of Them | Buy + Sell |
| Simple Moving Averages (SMA) Period | Value $ | Signal | Exponential Moving Averages (EMA) Period | Value $ | Signal | |
|---|---|---|---|---|---|---|
| 2 | 166.47 | SELL | 2 | 166.22 | SELL | |
| 3 | 166.64 | SELL | 3 | 166.36 | SELL | |
| 5 | 166.67 | SELL | 5 | 166.56 | SELL | |
| 8 | 165.88 | SELL | 8 | 167.20 | SELL | |
| 13 | 168.69 | SELL | 13 | 168.20 | SELL | |
| 21 | 172.14 | SELL | 21 | 168.16 | SELL | |
| 34 | 168.98 | SELL | 34 | 165.57 | BUY | |
| 55 | 158.81 | BUY | 55 | 160.25 | BUY | |
| 90 | 148.57 | BUY | 90 | 153.22 | BUY | |
| 200 | 138.23 | BUY | 200 | 141.78 | BUY |
Valero Energy Corp
IPO: 1980-01-02
Ticker: VLOIndices: S&P 500,
Exchange: New York Stock Exchange, Inc. (US - USD)
Website: https://www.valero.com/
Phone:
Common Stock
Energy & Transportation (
Petroleum Refining
 Click to Enlarge