
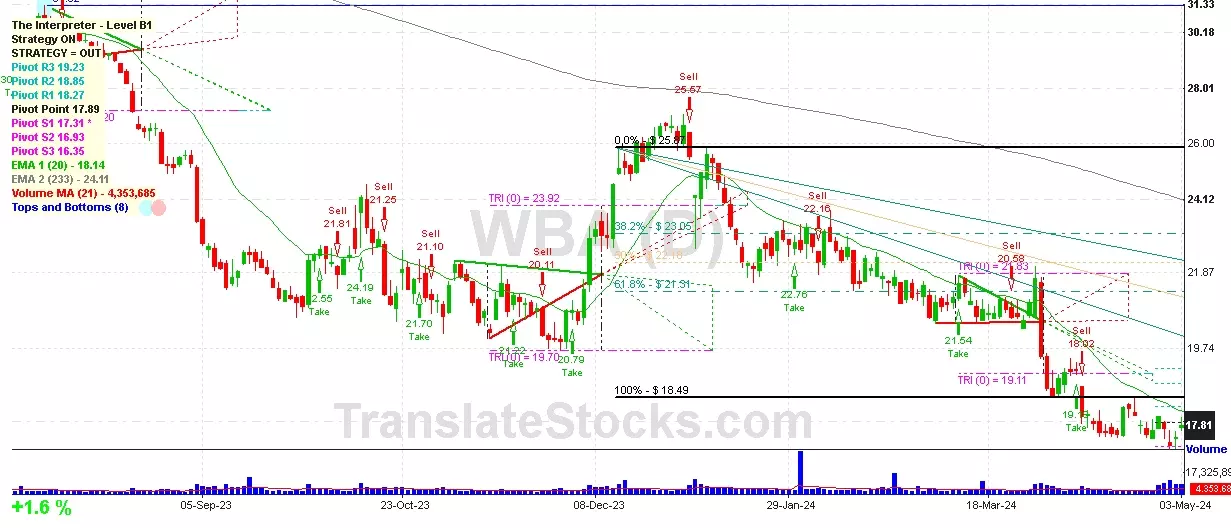
Hey Friend, I'm analysing WALGREENS BOOTS ALLIANCE INC (WBA), and it is between the Support of $ 17.31 (PivotS1) and the Resistance of $ 17.89 (Pivot). The stock is also approaching the line of Pivot at $ 17.89, and if it goes above this line it could reach the next Resistance of 100% of Fibonacci at $ 18.49.

| Date | Price $ | Result % | Candle Name | Side |
|---|---|---|---|---|
| 001 26 Apr 2024 | Buy Price: 17.70 | Profit: Open Day1 ($ 17.74) | Piercing Line | Buy |
| 002 27 Mar 2024 | Buy Price: 21.02 | Profit: Close Day1 ($ 21.69) | Abandoned Baby | Buy |
| 003 23 Feb 2024 | Buy Price: 21.73 | Loss: Close Day2 ($ 21.63) | Engulfing | Buy |
| 004 31 Jan 2024 | Sell Price: 22.57 | Loss: Close Day2 ($ 22.64) | Engulfing | Sell |
| 005 28 Dec 2023 | Sell Price: 26.60 | Profit: Open Day1 ($ 26.44) | Abandoned Baby | Sell |
| 006 14 Nov 2023 | Buy Price: 21.09 | Profit: Open Day1 ($ 21.19) | Abandoned Baby | Buy |
| 007 31 Aug 2023 | Sell Price: 25.31 | Profit: Open Day1 ($ 25.17) | Abandoned Baby | Sell |
| 008 18 May 2023 | Sell Price: 31.46 | Profit: Close Day1 ($ 31.28) | Abandoned Baby | Sell |
| 009One Year Average | Both Sides Result for 8 Signals |
Profit: $ 1.12 ($ 0.14 / Signal) |
All of Them | Buy + Sell |
| Simple Moving Averages (SMA) Period | Value $ | Signal | Exponential Moving Averages (EMA) Period | Value $ | Signal | |
|---|---|---|---|---|---|---|
| 2 | 17.44 | BUY | 2 | 17.52 | BUY | |
| 3 | 17.53 | SELL | 3 | 17.55 | SELL | |
| 5 | 17.66 | SELL | 5 | 17.62 | SELL | |
| 8 | 17.72 | SELL | 8 | 17.70 | SELL | |
| 13 | 17.78 | SELL | 13 | 17.87 | SELL | |
| 21 | 18.05 | SELL | 21 | 18.22 | SELL | |
| 34 | 18.95 | SELL | 34 | 18.81 | SELL | |
| 55 | 19.88 | SELL | 55 | 19.60 | SELL | |
| 90 | 21.37 | SELL | 90 | 20.57 | SELL | |
| 200 | 22.75 | SELL | 200 | 23.31 | SELL |
Walgreens Boots Alliance Inc
IPO: 2014-12-31
Ticker: WBAIndices: Dow 30,
S&P 500,
Nasdaq 100,
Exchange: Nasdaq Nms - Global Market (US - USD)
Website: http://www.walgreensbootsalliance.com/
Phone:
Common Stock
Trade & Services (
Retail-drug Stores And Proprietary Stores
 Click to Enlarge