| Date | Price $ | Result % | Candle Name | Side |
|---|---|---|---|---|
| 001 20 Mar 2024 | Buy Price: 57.30 | Profit: Open Day1 ($ 57.59) | Piercing Line | Buy |
| 002 14 Mar 2024 | Sell Price: 57.37 | Profit: Open Day1 ($ 56.86) | Engulfing | Sell |
| 003 14 Mar 2024 | Sell Price: 57.35 | Profit: Open Day1 ($ 56.86) | Dark Cloud Cover | Sell |
| 004 01 Nov 2023 | Sell Price: 39.61 | Loss: Close Day2 ($ 41.62) | Engulfing | Sell |
| 005 26 Oct 2023 | Buy Price: 39.65 | Loss: Close Day2 ($ 39.43) | Engulfing | Buy |
| 006 29 Sep 2023 | Sell Price: 40.86 | Profit: Open Day1 ($ 40.70) | Dark Cloud Cover | Sell |
| 007 21 Jul 2023 | Sell Price: 45.96 | Profit: Close Day2 ($ 45.48) | Engulfing | Sell |
| 008 25 May 2023 | Buy Price: 40.90 | Profit: Close Day1 ($ 41.23) | Engulfing | Buy |
| 009 24 May 2023 | Sell Price: 40.87 | Profit: Open Day1 ($ 40.62) | Abandoned Baby | Sell |
| 010One Year Average | Both Sides Result for 9 Signals |
Profit: $ 0.28 ($ 0.03 / Signal) |
All of Them | Buy + Sell |
| Simple Moving Averages (SMA) Period | Value $ | Signal | Exponential Moving Averages (EMA) Period | Value $ | Signal | |
|---|---|---|---|---|---|---|
| 2 | 60.07 | BUY | 2 | 60.08 | BUY | |
| 3 | 59.99 | BUY | 3 | 60.01 | BUY | |
| 5 | 59.76 | BUY | 5 | 59.92 | BUY | |
| 8 | 59.81 | BUY | 8 | 59.82 | BUY | |
| 13 | 60.01 | BUY | 13 | 59.55 | BUY | |
| 21 | 58.87 | BUY | 21 | 59.07 | BUY | |
| 34 | 58.25 | BUY | 34 | 58.23 | BUY | |
| 55 | 57.22 | BUY | 55 | 56.76 | BUY | |
| 90 | 54.02 | BUY | 90 | 54.50 | BUY | |
| 200 | 47.90 | BUY | 200 | 50.14 | BUY |
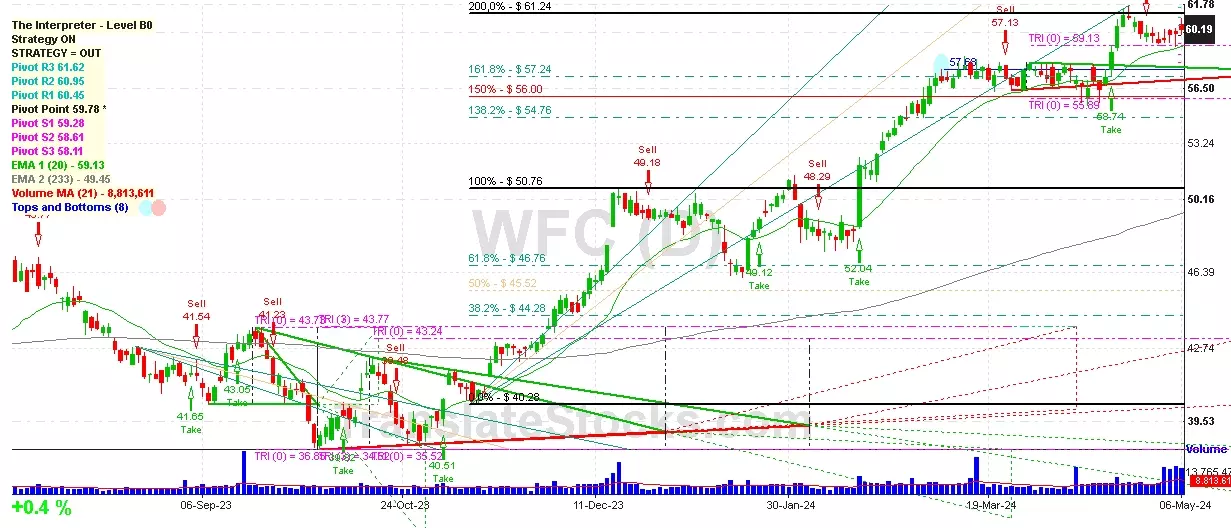
Wells Fargo & Co
IPO: 1962-12-10
Ticker: WFCIndices: S&P 500,
Exchange: New York Stock Exchange, Inc. (US - USD)
Website: https://www.wellsfargo.com
Phone:
Common Stock
Finance (
National Commercial Banks

 Click to Enlarge