
| Date | Price $ | Result % | Candle Name | Side |
|---|---|---|---|---|
| 001 26 Mar 2024 | Sell Price: 112.23 | Loss: Close Day2 ($ 119.63) | Dark Cloud Cover | Sell |
| 002 23 Feb 2024 | Sell Price: 110.56 | Profit: Open Day1 ($ 109.62) | Engulfing | Sell |
| 003 20 Feb 2024 | Buy Price: 109.40 | Profit: Open Day1 ($ 109.49) | Engulfing | Buy |
| 004 06 Feb 2024 | Buy Price: 109.23 | Profit: Open Day1 ($ 110.18) | Engulfing | Buy |
| 005 02 Feb 2024 | Sell Price: 110.44 | Profit: Open Day1 ($ 109.14) | Abandoned Baby | Sell |
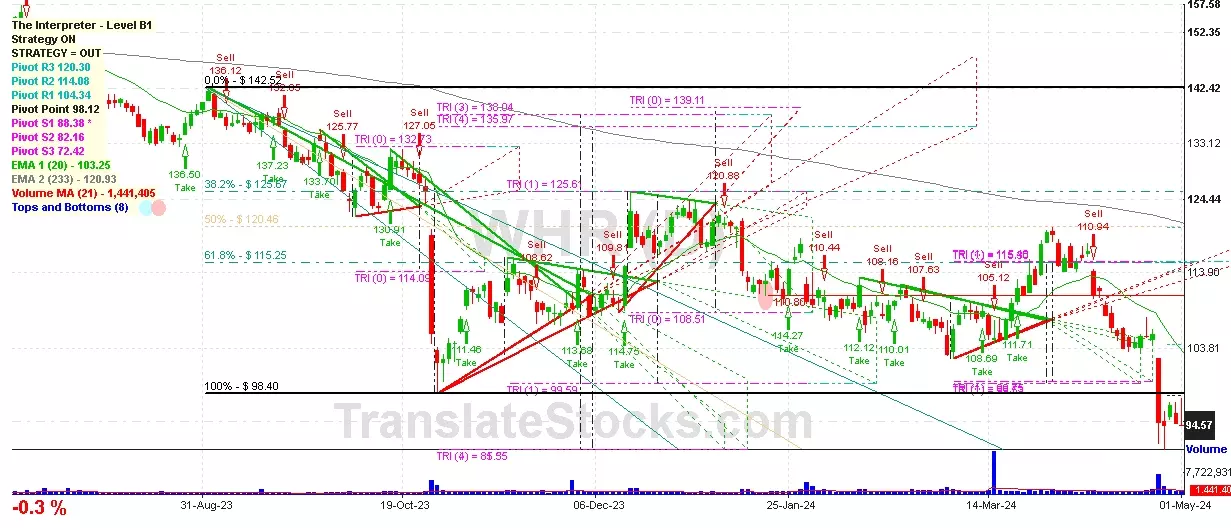
| 006 09 Jan 2024 | Sell Price: 120.88 | Profit: Close Day1 ($ 120.64) | Abandoned Baby | Sell |
| 007 02 Jan 2024 | Buy Price: 122.90 | Loss: Close Day2 ($ 118.16) | Engulfing | Buy |
| 008 29 Nov 2023 | Buy Price: 109.63 | Profit: Open Day1 ($ 109.74) | Abandoned Baby | Buy |
| 009 16 Oct 2023 | Buy Price: 126.57 | Profit: Close Day1 ($ 130.91) | Abandoned Baby | Buy |
| 010 12 Oct 2023 | Sell Price: 123.53 | Profit: Open Day1 ($ 123.35) | Abandoned Baby | Sell |
| 011 20 Jul 2023 | Sell Price: 151.47 | Profit: Close Day1 ($ 149.73) | Abandoned Baby | Sell |
| 012 07 Jul 2023 | Buy Price: 148.28 | Profit: Open Day1 ($ 148.59) | Abandoned Baby | Buy |
| 013 26 Jun 2023 | Buy Price: 142.78 | Profit: Open Day1 ($ 142.91) | Abandoned Baby | Buy |
| 014 14 Jun 2023 | Sell Price: 145.96 | Profit: Open Day1 ($ 145.87) | Dark Cloud Cover | Sell |
| 015 01 Jun 2023 | Buy Price: 131.40 | Profit: Open Day1 ($ 133.30) | Engulfing | Buy |
| 016 30 May 2023 | Sell Price: 132.76 | Profit: Open Day1 ($ 130.64) | Dark Cloud Cover | Sell |
| 017One Year Average | Both Sides Result for 16 Signals |
Profit: $ 2.30 ($ 0.14 / Signal) |
All of Them | Buy + Sell |
| Simple Moving Averages (SMA) Period | Value $ | Signal | Exponential Moving Averages (EMA) Period | Value $ | Signal | |
|---|---|---|---|---|---|---|
| 2 | 94.72 | SELL | 2 | 94.86 | SELL | |
| 3 | 95.44 | SELL | 3 | 95.29 | SELL | |
| 5 | 95.18 | SELL | 5 | 96.45 | SELL | |
| 8 | 99.05 | SELL | 8 | 98.28 | SELL | |
| 13 | 101.32 | SELL | 13 | 100.83 | SELL | |
| 21 | 106.00 | SELL | 21 | 103.51 | SELL | |
| 34 | 108.20 | SELL | 34 | 105.80 | SELL | |
| 55 | 108.18 | SELL | 55 | 107.81 | SELL | |
| 90 | 110.97 | SELL | 90 | 110.41 | SELL | |
| 200 | 119.87 | SELL | 200 | 118.41 | SELL |
Whirlpool Corp
IPO: 1955-09-19
Ticker: WHRIndices: S&P 500,
Exchange: New York Stock Exchange, Inc. (US - USD)
Website: https://www.whirlpoolcorp.com/
Phone:
Common Stock
Manufacturing (
Household Appliances

 Click to Enlarge