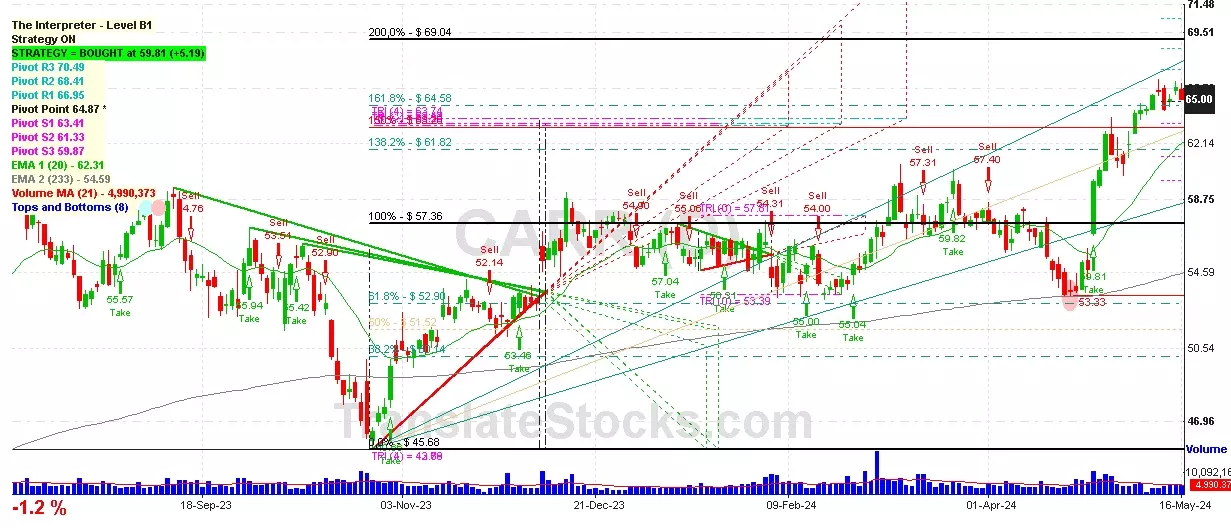
Hey Friend, I'm analysing CARRIER GLOBAL CORP (CARR), and it is between the Support of $ 64.87 (Pivot) and the Resistance of $ 66.95 (PivotR1). The stock is also approaching the line of Pivot at $ 64.87, and if it goes below this line it could reach the next Support of 161.8% of Fibonacci at $ 64.58.

| Date | Price $ | Result % | Candle Name | Side |
|---|---|---|---|---|
| 001 12 Apr 2024 | Buy Price: 56.84 | Profit: Open Day1 ($ 57.30) | Piercing Line | Buy |
| 002 18 Mar 2024 | Buy Price: 57.10 | Profit: Open Day1 ($ 57.13) | Abandoned Baby | Buy |
| 003 21 Feb 2024 | Buy Price: 53.77 | Profit: Open Day1 ($ 54.22) | Abandoned Baby | Buy |
| 004 07 Nov 2023 | Buy Price: 50.45 | Profit: Open Day1 ($ 50.56) | Engulfing | Buy |
| 005 07 Nov 2023 | Buy Price: 50.42 | Profit: Open Day1 ($ 50.56) | Piercing Line | Buy |
| 006 24 Oct 2023 | Sell Price: 48.15 | Profit: Open Day1 ($ 47.87) | Engulfing | Sell |
| 007 24 Oct 2023 | Sell Price: 48.25 | Profit: Open Day1 ($ 47.87) | Dark Cloud Cover | Sell |
| 008One Year Average | Both Sides Result for 7 Signals |
Profit: $ 1.86 ($ 0.27 / Signal) |
All of Them | Buy + Sell |
| Simple Moving Averages (SMA) Period | Value $ | Signal | Exponential Moving Averages (EMA) Period | Value $ | Signal | |
|---|---|---|---|---|---|---|
| 2 | 65.40 | SELL | 2 | 65.15 | SELL | |
| 3 | 65.25 | SELL | 3 | 65.14 | SELL | |
| 5 | 65.12 | SELL | 5 | 64.99 | BUY | |
| 8 | 64.92 | BUY | 8 | 64.53 | BUY | |
| 13 | 63.78 | BUY | 13 | 63.53 | BUY | |
| 21 | 61.07 | BUY | 21 | 62.15 | BUY | |
| 34 | 59.32 | BUY | 34 | 60.70 | BUY | |
| 55 | 58.68 | BUY | 55 | 59.34 | BUY | |
| 90 | 57.39 | BUY | 90 | 58.00 | BUY | |
| 200 | 55.56 | BUY | 200 | 55.20 | BUY |
Carrier Global Corp
IPO: 2020-03-17
Ticker: CARRIndices: S&P 500,
Exchange: New York Stock Exchange, Inc. (US - USD)
Website: https://www.carrier.com/
Phone:
Common Stock
Technology (
Air-cond & Warm Air Heatg Equip & Comm & Indl Refrig Equip
 Click to Enlarge