| Date | Price $ | Result % | Candle Name | Side |
|---|---|---|---|---|
| 001 04 Apr 2024 | Sell Price: 304.83 | Loss: Close Day2 ($ 306.86) | Engulfing | Sell |
| 002 05 Mar 2024 | Sell Price: 280.61 | Loss: Close Day2 ($ 293.07) | Abandoned Baby | Sell |
| 003 01 Mar 2024 | Sell Price: 276.60 | Loss: Close Day2 ($ 280.61) | Engulfing | Sell |
| 004 29 Feb 2024 | Buy Price: 279.27 | Profit: Open Day1 ($ 280.90) | Abandoned Baby | Buy |
| 005 20 Feb 2024 | Buy Price: 272.91 | Profit: Open Day1 ($ 274.26) | Piercing Line | Buy |
| 006 02 Jan 2024 | Sell Price: 281.56 | Profit: Open Day1 ($ 278.71) | Abandoned Baby | Sell |
| 007 24 Aug 2023 | Sell Price: 262.03 | Loss: Close Day2 ($ 270.84) | Engulfing | Sell |
| 008 19 Jul 2023 | Sell Price: 255.26 | Profit: Close Day1 ($ 253.16) | Engulfing | Sell |
| 009 14 Jul 2023 | Sell Price: 258.99 | Profit: Open Day1 ($ 258.04) | Engulfing | Sell |
| 010 05 Jul 2023 | Sell Price: 250.99 | Profit: Open Day1 ($ 248.75) | Abandoned Baby | Sell |
| 011 15 Jun 2023 | Buy Price: 244.45 | Profit: Open Day1 ($ 246.55) | Engulfing | Buy |
| 012One Year Average | Both Sides Result for 11 Signals |
Loss: $ -14.09 ($ -1.28 / Signal) |
All of Them | Buy + Sell |
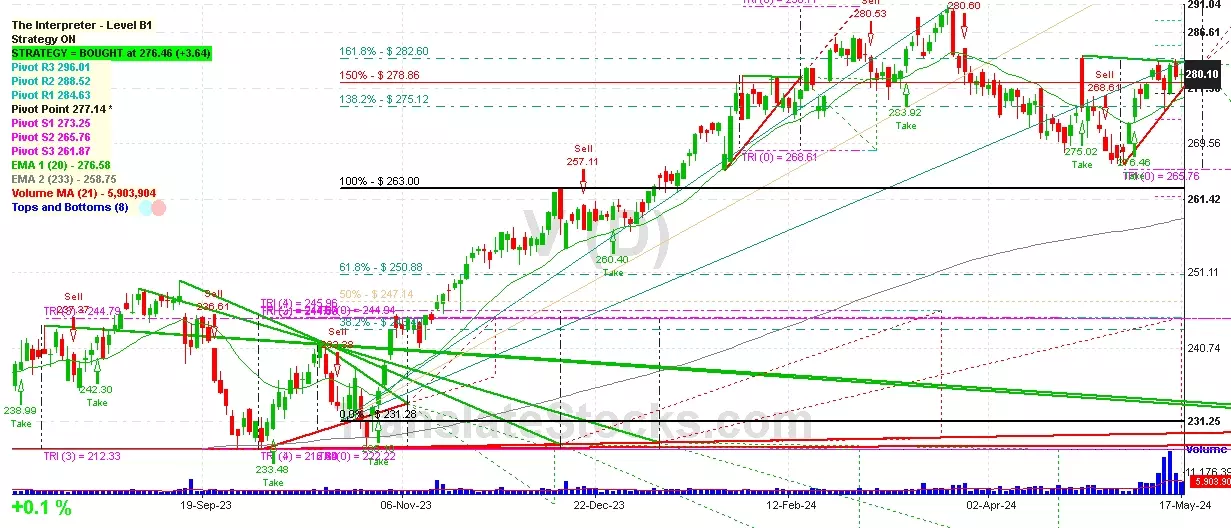
| Simple Moving Averages (SMA) Period | Value $ | Signal | Exponential Moving Averages (EMA) Period | Value $ | Signal | |
|---|---|---|---|---|---|---|
| 2 | 280.96 | BUY | 2 | 282.20 | BUY | |
| 3 | 281.74 | BUY | 3 | 282.60 | BUY | |
| 5 | 283.23 | SELL | 5 | 284.35 | SELL | |
| 8 | 288.58 | SELL | 8 | 287.14 | SELL | |
| 13 | 292.91 | SELL | 13 | 290.56 | SELL | |
| 21 | 296.36 | SELL | 21 | 293.64 | SELL | |
| 34 | 299.39 | SELL | 34 | 295.32 | SELL | |
| 55 | 298.10 | SELL | 55 | 294.27 | SELL | |
| 90 | 291.95 | SELL | 90 | 289.55 | SELL | |
| 200 | 272.36 | BUY | 200 | 273.98 | BUY |
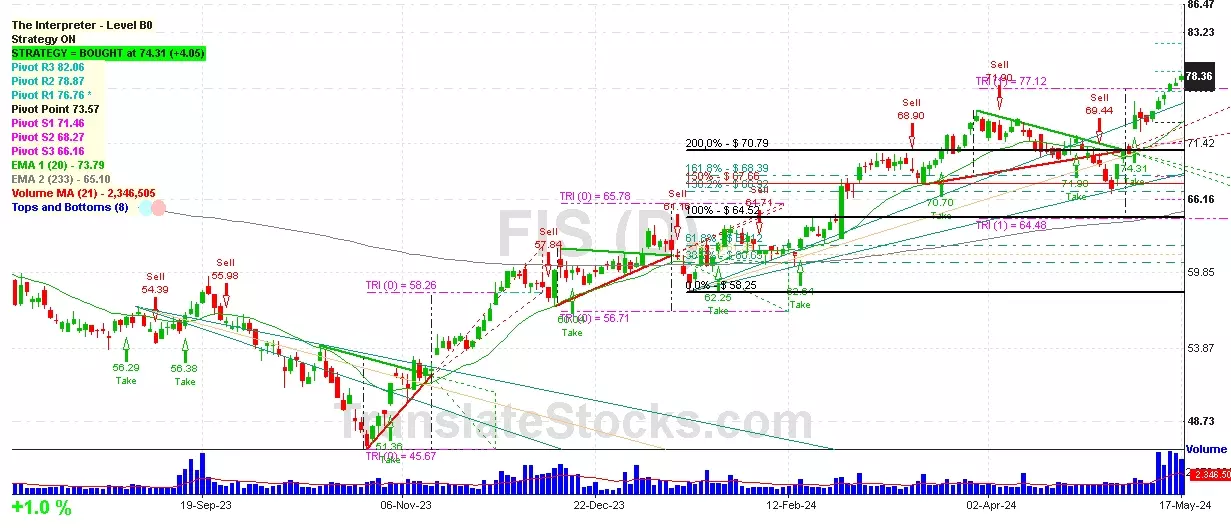
Fleetcor Technologies Inc
IPO: 2010-12-15
Ticker: FLTIndices: S&P 500,
Exchange: New York Stock Exchange, Inc. (US - USD)
Website: http://www.fleetcor.com/
Phone:
Common Stock
Trade & Services (
Services-business Services, Nec
Year | 2020 | 2019 | 2018 | 2017 | 2016 | 2015 | 2014 | 2013 | 2012 | 2011 | 2010 | 2009 | 2008 | |
|---|---|---|---|---|---|---|---|---|---|---|---|---|---|---|
| 1 | Assets + | 11,195 | 12,249 | 11,202 | 11,318 | 9,627 | 7,890 | 8,675 | 3,932 | 2,722 | 2,324 | 1,484 | 675 | 70 |
| 2 | Investments in and Advance to Affiliates + | 7 | 30 | 43 | 33 | 36 | 77 | 142 | 0 | 0 | 0 | 0 | 0 | 0 |
| 3 | Cash and Cash Equivalents + | 935 | 1,271 | 1,031 | 914 | 475 | 447 | 477 | 338 | 284 | 285 | 115 | 85 | 70 |
| 4 | Property + | 203 | 200 | 186 | 180 | 143 | 81 | 74 | 54 | 45 | 33 | 27 | 0 | 0 |
| 5 | Property + | 469 | 414 | 352 | 311 | 253 | 164 | 135 | 111 | 94 | 93 | 83 | 0 | 0 |
| 6 | Intangible Assets + | 2,116 | 2,342 | 2,408 | 2,725 | 2,653 | 2,184 | 2,437 | 871 | 464 | 299 | 194 | 0 | 0 |
| 7 | Finite-Lived Intangible Assets + | -1,352 | -1,166 | -960 | -743 | -556 | -395 | -235 | 871 | 464 | 378 | 263 | 0 | 0 |
| 8 | Liabilities and Equity + | 11,195 | 12,249 | 11,202 | 11,318 | 9,627 | 7,890 | 8,675 | 3,932 | 2,722 | 2,324 | 1,484 | 474 | 273 |
| 9 | Liabilities + | 7,839 | 8,537 | 7,862 | 7,642 | 6,542 | 5,059 | 5,922 | 2,688 | 1,808 | 1,513 | 858 | 0 | 0 |
| 10 | Stockholders' Equity + | 3,355 | 3,712 | 3,340 | 3,677 | 3,084 | 2,830 | 2,619 | 1,224 | 914 | 811 | 626 | 474 | 273 |
| 11 | Stockholders' Equity Attributable to Parent + | 3,355 | 3,712 | 3,340 | 3,677 | 3,084 | 2,830 | 2,619 | 1,224 | 914 | 811 | 626 | 474 | 273 |
| 12 | Stockholders' Equity + | 0 | 0 | 0 | 0 | 0 | 0 | 0 | 0 | 0 | 0 | 18 | 0 | 0 |
| 13 | Preferred Stock + | 0 | 0 | 0 | 0 | 0 | 0 | 0 | 0 | 0 | 0 | 18 | 0 | 0 |
| 14 | Common Stock + | 0 | 0 | 0 | 0 | 0 | 0 | 0 | 0 | 0 | 0 | 0 | 0 | 0 |
| 15 | Partners' Capital + | 5,417 | 4,713 | 3,818 | 2,959 | 2,219 | 1,766 | 1,404 | 1,035 | 751 | 534 | 387 | 0 | 0 |
| 16 | Partners' Capital + | 5,417 | 4,713 | 3,818 | 2,959 | 2,219 | 1,766 | 1,404 | 1,035 | 751 | 534 | 387 | 0 | 0 |
| 17 | Limited Liability Company (LLC) Members' Equity + | 4,054 | 3,741 | 2,904 | 2,407 | 1,553 | 1,195 | 1,247 | 988 | 748 | 520 | 379 | 0 | 0 |
| 18 | Limited Liability Company (LLC) Members' Equity + | 4,054 | 3,741 | 2,904 | 2,407 | 1,553 | 1,195 | 1,247 | 988 | 748 | 520 | 379 | 0 | 0 |
| 19 | Current Assets + | 3,956 | 4,619 | 3,876 | 3,550 | 2,528 | 1,945 | 2,137 | 1,354 | 1,195 | 1,123 | 619 | 0 | 0 |
| 20 | Cash + | 542 | 404 | 334 | 217 | 169 | 167 | 135 | 48 | 54 | 56 | 62 | 0 | 0 |
| 21 | Current Receivables + | 700 | 971 | 886 | 811 | 591 | 614 | 675 | 349 | 298 | 280 | 144 | 0 | 0 |
| 22 | Long-Term Assets + | 4,994 | 5,145 | 4,693 | 4,831 | 4,267 | 3,604 | 3,785 | 1,654 | 1,018 | 870 | 645 | 590 | 0 |
| 23 | Current Liabilities + | 3,968 | 4,463 | 4,495 | 4,096 | 3,296 | 2,247 | 2,897 | 1,909 | 1,142 | 1,122 | 461 | 0 | 0 |
| 24 | Long-Term Liabilities + | 3,871 | 4,074 | 3,367 | 3,546 | 3,246 | 2,812 | 3,025 | 779 | 666 | 391 | 397 | 0 | 0 |
| 25 | Increase (Decrease) in Stockholders' Equity [Roll Forward] + | -3,448 | -2,523 | -1,871 | -945 | -542 | -355 | -346 | -376 | -376 | -176 | -175 | 0 | 0 |
| 26 | Treasury Stock Transactions + | -3,448 | -2,523 | -1,871 | -945 | -542 | -355 | -346 | -376 | -376 | -176 | -175 | 0 | 0 |
| 27 | Treasury Stock + | -3,448 | -2,523 | -1,871 | -945 | -542 | -355 | -346 | -376 | -376 | -176 | -175 | 0 | 0 |
| 28 | Total Current Assets + | 3,956 | 4,619 | 3,876 | 3,550 | 2,528 | 1,945 | 2,137 | 1,354 | 1,195 | 1,123 | 619 | 0 | 0 |
| 29 | Operating Lease + | 77 | 84 | 0 | 0 | 0 | 0 | 0 | 0 | 0 | 0 | 0 | 0 | 0 |
| 30 | Goodwill + | 4,719 | 4,833 | 4,542 | 4,716 | 4,195 | 3,546 | 3,713 | 1,553 | 927 | 824 | 602 | 590 | 0 |
| 31 | Long-Term Other Assets + | 193 | 225 | 148 | 115 | 72 | 58 | 72 | 101 | 91 | 46 | 43 | 0 | 0 |
| 32 | Deferred Income Tax Assets + | 198 | 228 | 151 | 0 | 0 | 0 | 0 | 0 | 0 | 0 | 0 | 0 | 0 |
| 33 | Total Assets + | 11,195 | 12,249 | 11,202 | 11,318 | 9,627 | 7,890 | 8,675 | 3,932 | 2,722 | 2,324 | 1,484 | 0 | 0 |
| 34 | Total Liabilities and Equity + | 11,195 | 12,249 | 11,202 | 11,318 | 9,627 | 7,890 | 8,675 | 3,932 | 2,722 | 2,324 | 1,484 | 0 | 0 |
Year | 2020 | 2019 | 2018 | 2017 | 2016 | 2015 | 2014 | 2013 | 2012 | 2011 | 2010 | 2009 | |
|---|---|---|---|---|---|---|---|---|---|---|---|---|---|
| 1 | 2,389 | 2,649 | 2,433 | 2,250 | 1,832 | 0 | 0 | 0 | 0 | 0 | 0 | 0 | |
| 2 | 0 | 0 | 0 | 0 | 0 | 0 | 0 | 3 | 3 | 3 | 0 | 0 | |
| 3 | 255 | 274 | 275 | 265 | 203 | 193 | 112 | 76 | 55 | 39 | 34 | 28 | |
| 4 | 0 | 0 | 0 | 0 | 3 | 2 | 3 | 6 | 2 | 0 | 0 | 0 | |
| 5 | 0 | 0 | 0 | 11 | 0 | 0 | 0 | 0 | 0 | 0 | 0 | 0 | |
| 6 | 193 | 205 | 183 | 171 | 131 | 109 | 76 | 57 | 46 | 37 | 33 | 0 | |
| 7 | 0 | 0 | 0 | 284 | 235 | 217 | 172 | 125 | 105 | 0 | 0 | 0 | |
| 8 | 375 | 407 | 389 | 388 | 284 | 298 | 206 | 142 | 110 | 85 | 78 | 51 | |
| 9 | 159 | 74 | 64 | 45 | 36 | 25 | 24 | 19 | 22 | 19 | 19 | 33 | |
| 10 | 0 | 0 | 153 | 175 | 0 | 0 | 0 | 0 | 0 | 0 | 0 | 0 | |
| 11 | 972 | 1,231 | 1,091 | 884 | 754 | 668 | 565 | 421 | 325 | 226 | 170 | 146 | |
| 12 | 13 | 13 | 0 | 0 | 0 | 0 | 0 | 0 | 0 | 0 | 0 | 0 | |
| 13 | 0 | 0 | -5 | -6 | -5 | -3 | -3 | -3 | -3 | 0 | 0 | 0 | |
| 14 | 3 | 1 | 0 | 0 | -3 | -2 | 1 | 0 | 0 | 0 | 0 | 0 | |
| 15 | 10 | 0 | 152 | 173 | -3 | -3 | 1 | -1 | -1 | 1 | 1 | 1 | |
| 16 | -90 | -154 | 4 | 10 | -111 | -132 | -53 | -17 | 0 | -15 | -19 | -16 | |
| 17 | 0 | 0 | 0 | 0 | 0 | 0 | 53 | 17 | 14 | 15 | 19 | 0 | |
| 18 | 0 | 0 | 0 | 0 | 0 | 0 | 0 | 0 | 13 | 13 | 6 | 7 | |
| 19 | 0 | 0 | 2 | 3 | 0 | 0 | 16 | 0 | 0 | 3 | 0 | 0 | |
| 20 | 0 | 0 | 0 | 0 | 0 | 0 | 513 | 404 | 311 | 211 | 151 | 130 | |
| 21 | 30 | -3 | -7 | -53 | -36 | -58 | -9 | 0 | 0 | 0 | 0 | 0 | |
| 22 | 883 | 1,078 | 1,095 | 894 | 643 | 536 | 513 | 404 | 311 | 211 | 151 | 130 | |
| 23 | -178 | -183 | -284 | -153 | -191 | -174 | -144 | -119 | -95 | -64 | -43 | -41 | |
| 24 | Total Net Income (Loss) Attributable to Parent + | 704 | 895 | 811 | 740 | 452 | 362 | 369 | 285 | 216 | 147 | 108 | 89 |
| 25 | 0 | 0 | 0 | 0 | 0 | 0 | 0 | 0 | 216 | 147 | 106 | 73 | |
| 26 | Total Earnings Per Share + | 8.38 | 10.36 | 9.14 | 8.12 | 4.89 | 3.94 | 4.37 | 3.48 | 2.59 | 1.83 | 3 | 2.17 |
| 27 | Total Earnings Per Share + | 8.12 | 9.94 | 8.81 | 7.91 | 4.75 | 3.85 | 4.24 | 3.36 | 2.52 | 1.76 | 1.34 | 1.13 |

 Click to Enlarge