
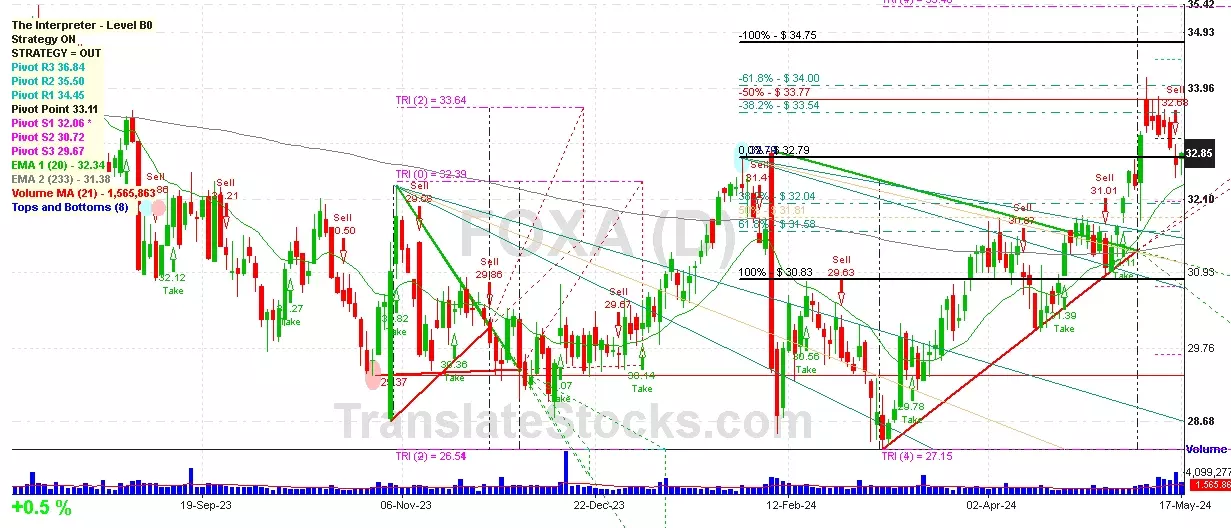
Hey Friend, I'm analysing FOX CORP CLASS A (FOXA), and it is between the Support of $ 32.79 (0% of Fibonacci) and the Resistance of $ 33.11 (Pivot). The stock is also approaching the line of Pivot at $ 33.11, and if it goes above this line it could reach the next Resistance of -38.2% of Fibonacci at $ 33.54.

| Date | Price $ | Result % | Candle Name | Side |
|---|---|---|---|---|
| 001 01 Mar 2024 | Sell Price: 29.42 | Profit: Open Day1 ($ 29.28) | Engulfing | Sell |
| 002 16 Jan 2024 | Sell Price: 30.75 | Profit: Open Day1 ($ 30.50) | Abandoned Baby | Sell |
| 003 15 Jun 2023 | Buy Price: 33.67 | Profit: Open Day1 ($ 33.73) | Engulfing | Buy |
| 004One Year Average | Both Sides Result for 3 Signals |
Profit: $ 0.45 ($ 0.15 / Signal) |
All of Them | Buy + Sell |
| Simple Moving Averages (SMA) Period | Value $ | Signal | Exponential Moving Averages (EMA) Period | Value $ | Signal | |
|---|---|---|---|---|---|---|
| 2 | 32.77 | BUY | 2 | 32.84 | BUY | |
| 3 | 32.83 | BUY | 3 | 32.87 | SELL | |
| 5 | 33.00 | SELL | 5 | 32.91 | SELL | |
| 8 | 33.11 | SELL | 8 | 32.85 | SELL | |
| 13 | 32.68 | BUY | 13 | 32.64 | BUY | |
| 21 | 32.22 | BUY | 21 | 32.30 | BUY | |
| 34 | 31.69 | BUY | 34 | 31.88 | BUY | |
| 55 | 30.97 | BUY | 55 | 31.46 | BUY | |
| 90 | 30.89 | BUY | 90 | 31.16 | BUY | |
| 200 | 30.99 | BUY | 200 | 31.24 | BUY |
Fox Corp - Class A
IPO: 2019-02-27
Ticker: FOXAIndices: S&P 500,
Nasdaq 100,
Exchange: Nasdaq Nms - Global Market (US - USD)
Website: https://www.foxcorporation.com/
Phone:
Common Stock
Technology (
Television Broadcasting Stations
 Click to Enlarge