| Date | Price $ | Result % | Candle Name | Side |
|---|---|---|---|---|
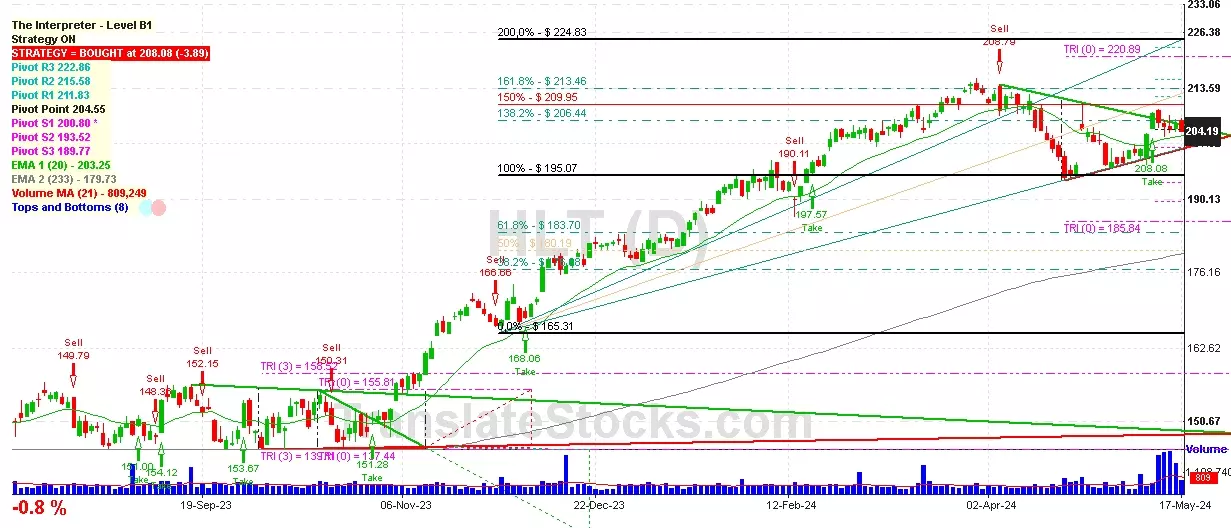
| 001 28 Mar 2024 | Sell Price: 213.31 | Profit: Close Day1 ($ 212.70) | Engulfing | Sell |
| 002 14 Mar 2024 | Sell Price: 206.92 | Profit: Open Day1 ($ 204.71) | Engulfing | Sell |
| 003 14 Feb 2024 | Buy Price: 192.70 | Profit: Open Day1 ($ 193.50) | Abandoned Baby | Buy |
| 004 16 Jan 2024 | Buy Price: 182.39 | Profit: Close Day1 ($ 183.52) | Piercing Line | Buy |
| 005 02 Jan 2024 | Sell Price: 180.07 | Profit: Open Day1 ($ 179.35) | Abandoned Baby | Sell |
| 006 24 Nov 2023 | Sell Price: 169.82 | Profit: Open Day1 ($ 169.47) | Abandoned Baby | Sell |
| 007 01 Nov 2023 | Sell Price: 151.13 | Profit: Open Day1 ($ 151.06) | Dark Cloud Cover | Sell |
| 008 25 Sep 2023 | Buy Price: 147.81 | Profit: Open Day2 ($ 148.05) | Engulfing | Buy |
| 009 04 Aug 2023 | Buy Price: 151.35 | Profit: Open Day1 ($ 151.53) | Abandoned Baby | Buy |
| 010 25 Jul 2023 | Buy Price: 151.20 | Profit: Open Day1 ($ 151.70) | Engulfing | Buy |
| 011 25 Jul 2023 | Buy Price: 151.13 | Profit: Open Day1 ($ 151.70) | Piercing Line | Buy |
| 012 15 Jun 2023 | Sell Price: 140.67 | Profit: Open Day2 ($ 139.97) | Abandoned Baby | Sell |
| 013One Year Average | Both Sides Result for 12 Signals |
Profit: $ 8.08 ($ 0.67 / Signal) |
All of Them | Buy + Sell |
| Simple Moving Averages (SMA) Period | Value $ | Signal | Exponential Moving Averages (EMA) Period | Value $ | Signal | |
|---|---|---|---|---|---|---|
| 2 | 204.99 | SELL | 2 | 204.61 | SELL | |
| 3 | 204.85 | SELL | 3 | 204.78 | SELL | |
| 5 | 205.19 | SELL | 5 | 204.71 | SELL | |
| 8 | 204.74 | SELL | 8 | 204.20 | SELL | |
| 13 | 202.35 | BUY | 13 | 203.51 | BUY | |
| 21 | 201.30 | BUY | 21 | 203.23 | BUY | |
| 34 | 203.63 | BUY | 34 | 203.20 | BUY | |
| 55 | 205.29 | SELL | 55 | 201.97 | BUY | |
| 90 | 200.56 | BUY | 90 | 197.60 | BUY | |
| 200 | 178.09 | BUY | 200 | 183.05 | BUY |
Hilton Worldwide Holdings In
IPO: 2013-12-12
Ticker: HLTIndices: S&P 500,
Exchange: New York Stock Exchange, Inc. (US - USD)
Website: https://www.hilton.com
Phone:
Common Stock
Real Estate & Construction (
Hotels & Motels

 Click to Enlarge