| Date | Price $ | Result % | Candle Name | Side |
|---|---|---|---|---|
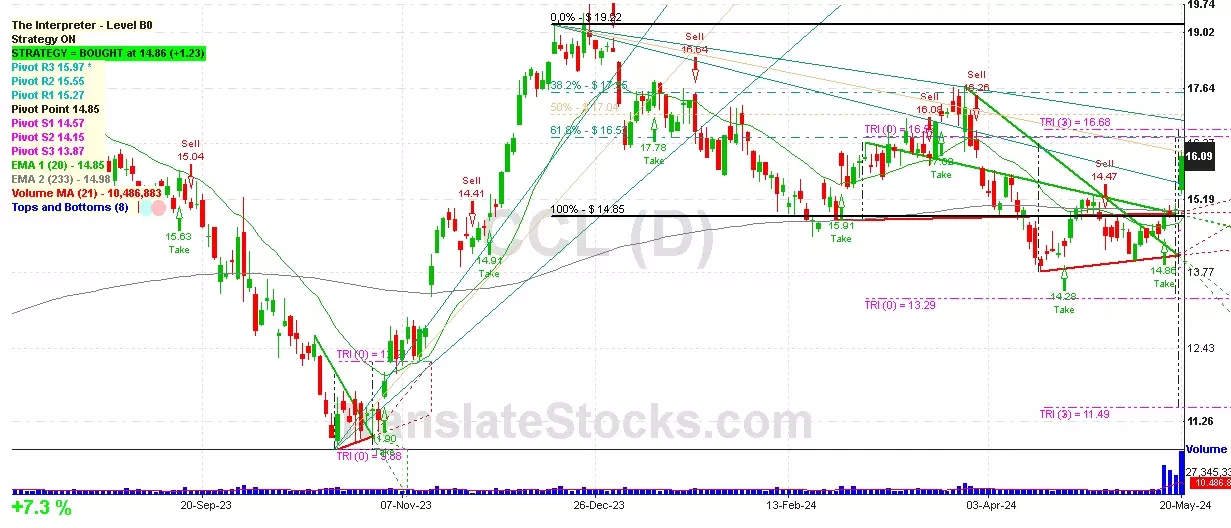
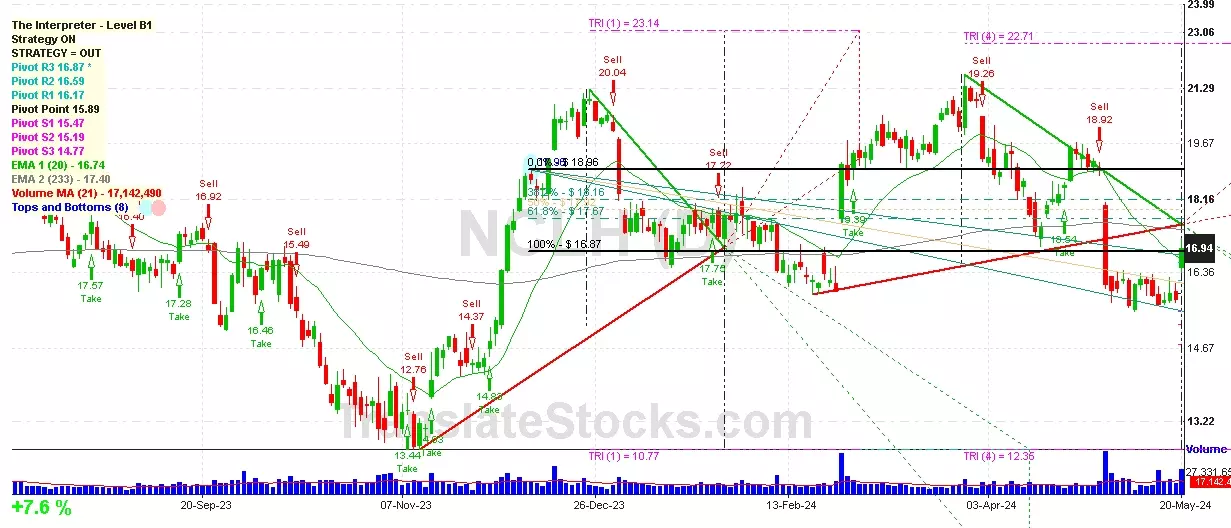
| 001 25 Mar 2024 | Sell Price: 20.56 | Profit: Close Day1 ($ 20.16) | Engulfing | Sell |
| 002 25 Mar 2024 | Sell Price: 20.54 | Profit: Close Day1 ($ 20.16) | Dark Cloud Cover | Sell |
| 003 13 Mar 2024 | Buy Price: 19.87 | Loss: Close Day2 ($ 19.40) | Engulfing | Buy |
| 004 09 Feb 2024 | Sell Price: 16.42 | Profit: Open Day1 ($ 16.37) | Engulfing | Sell |
| 005 20 Sep 2023 | Sell Price: 17.15 | Profit: Open Day1 ($ 17.00) | Engulfing | Sell |
| 006 20 Sep 2023 | Sell Price: 17.17 | Profit: Open Day1 ($ 17.00) | Dark Cloud Cover | Sell |
| 007 05 Sep 2023 | Buy Price: 16.66 | Loss: Close Day2 ($ 16.49) | Engulfing | Buy |
| 008One Year Average | Both Sides Result for 7 Signals |
Profit: $ 0.50 ($ 0.07 / Signal) |
All of Them | Buy + Sell |
| Simple Moving Averages (SMA) Period | Value $ | Signal | Exponential Moving Averages (EMA) Period | Value $ | Signal | |
|---|---|---|---|---|---|---|
| 2 | 16.35 | BUY | 2 | 16.55 | BUY | |
| 3 | 16.19 | BUY | 3 | 16.36 | BUY | |
| 5 | 15.98 | BUY | 5 | 16.20 | BUY | |
| 8 | 16.01 | BUY | 8 | 16.18 | BUY | |
| 13 | 15.99 | BUY | 13 | 16.37 | BUY | |
| 21 | 17.04 | SELL | 21 | 16.79 | BUY | |
| 34 | 17.58 | SELL | 34 | 17.29 | SELL | |
| 55 | 18.51 | SELL | 55 | 17.66 | SELL | |
| 90 | 18.04 | SELL | 90 | 17.77 | SELL | |
| 200 | 17.18 | SELL | 200 | 17.46 | SELL |
Norwegian Cruise Line Holdin
IPO: 2013-01-16
Ticker: NCLHIndices: S&P 500,
Exchange: New York Stock Exchange, Inc. (US - USD)
Website: http://www.nclhltd.com/
Phone:
Common Stock
Energy & Transportation (
Water Transportation
 Click to Enlarge