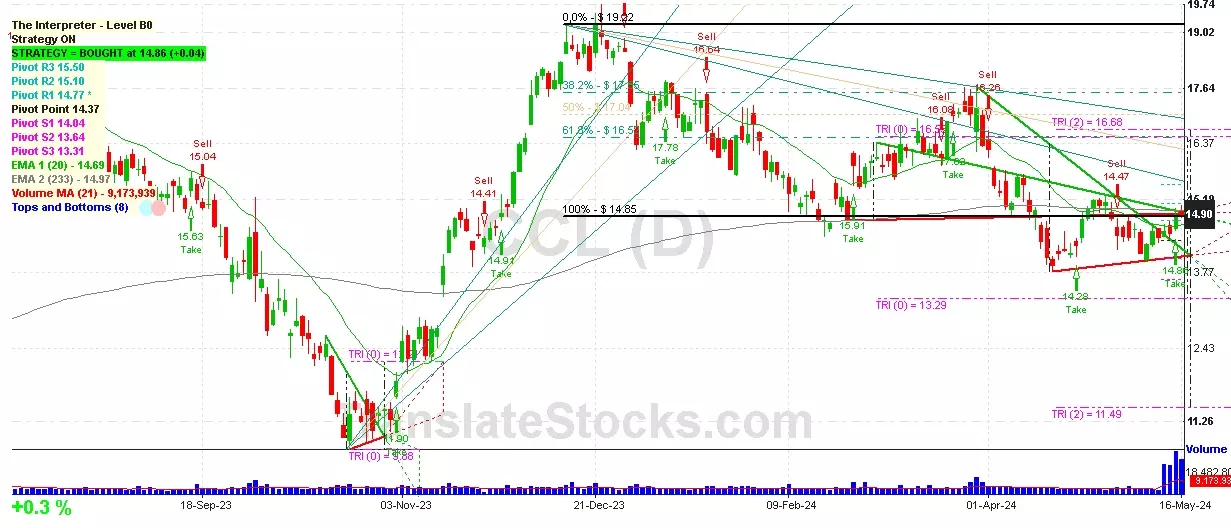
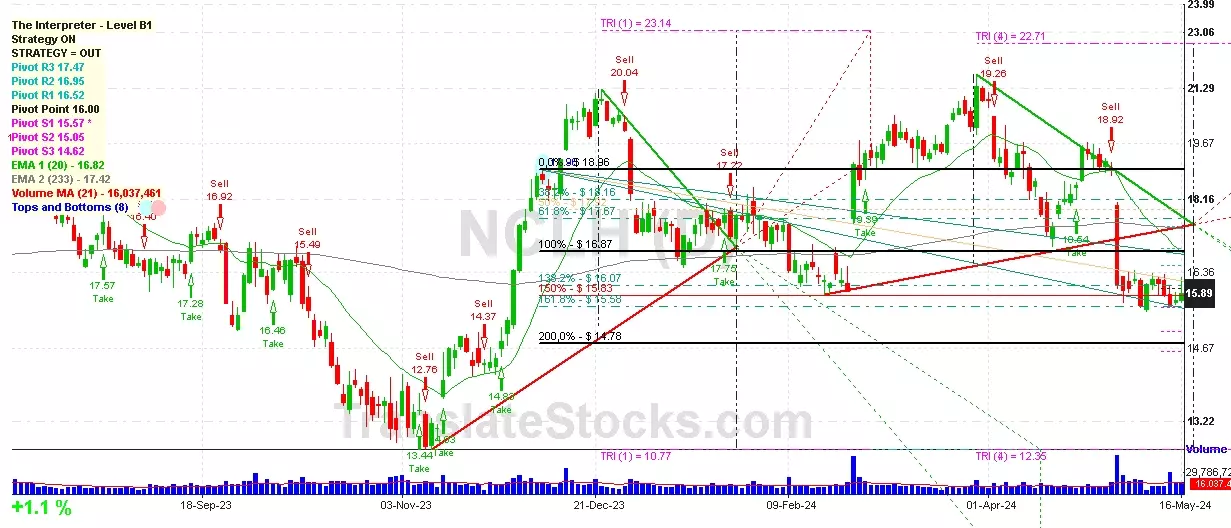
Hey Friend, I'm analysing NORWEGIAN CRUISE LINE HOLDIN (NCLH), and it is between the Support of $ 15.83 (150% of Fibonacci) and the Resistance of $ 16.00 (Pivot). The stock is also approaching the line of Pivot at $ 16.00, and if it goes above this line it could reach the next Resistance of 138.2% of Fibonacci at $ 16.07.

| Date | Price $ | Result % | Candle Name | Side |
|---|---|---|---|---|
| 001 25 Mar 2024 | Sell Price: 20.56 | Profit: Close Day1 ($ 20.16) | Engulfing | Sell |
| 002 25 Mar 2024 | Sell Price: 20.54 | Profit: Close Day1 ($ 20.16) | Dark Cloud Cover | Sell |
| 003 13 Mar 2024 | Buy Price: 19.87 | Loss: Close Day2 ($ 19.40) | Engulfing | Buy |
| 004 09 Feb 2024 | Sell Price: 16.42 | Profit: Open Day1 ($ 16.37) | Engulfing | Sell |
| 005 20 Sep 2023 | Sell Price: 17.15 | Profit: Open Day1 ($ 17.00) | Engulfing | Sell |
| 006 20 Sep 2023 | Sell Price: 17.17 | Profit: Open Day1 ($ 17.00) | Dark Cloud Cover | Sell |
| 007 05 Sep 2023 | Buy Price: 16.66 | Loss: Close Day2 ($ 16.49) | Engulfing | Buy |
| 008 19 May 2023 | Sell Price: 14.15 | Loss: Close Day2 ($ 14.47) | Engulfing | Sell |
| 009One Year Average | Both Sides Result for 8 Signals |
Profit: $ 0.18 ($ 0.02 / Signal) |
All of Them | Buy + Sell |
| Simple Moving Averages (SMA) Period | Value $ | Signal | Exponential Moving Averages (EMA) Period | Value $ | Signal | |
|---|---|---|---|---|---|---|
| 2 | 15.81 | BUY | 2 | 15.83 | BUY | |
| 3 | 15.74 | BUY | 3 | 15.82 | BUY | |
| 5 | 15.83 | BUY | 5 | 15.87 | BUY | |
| 8 | 15.88 | BUY | 8 | 16.02 | SELL | |
| 13 | 16.17 | SELL | 13 | 16.37 | SELL | |
| 21 | 17.22 | SELL | 21 | 16.87 | SELL | |
| 34 | 17.80 | SELL | 34 | 17.40 | SELL | |
| 55 | 18.62 | SELL | 55 | 17.76 | SELL | |
| 90 | 18.06 | SELL | 90 | 17.84 | SELL | |
| 200 | 17.20 | SELL | 200 | 17.48 | SELL |
Norwegian Cruise Line Holdin
IPO: 2013-01-16
Ticker: NCLHIndices: S&P 500,
Exchange: New York Stock Exchange, Inc. (US - USD)
Website: http://www.nclhltd.com/
Phone:
Common Stock
Energy & Transportation (
Water Transportation
 Click to Enlarge