
| Date | Price $ | Result % | Candle Name | Side |
|---|---|---|---|---|
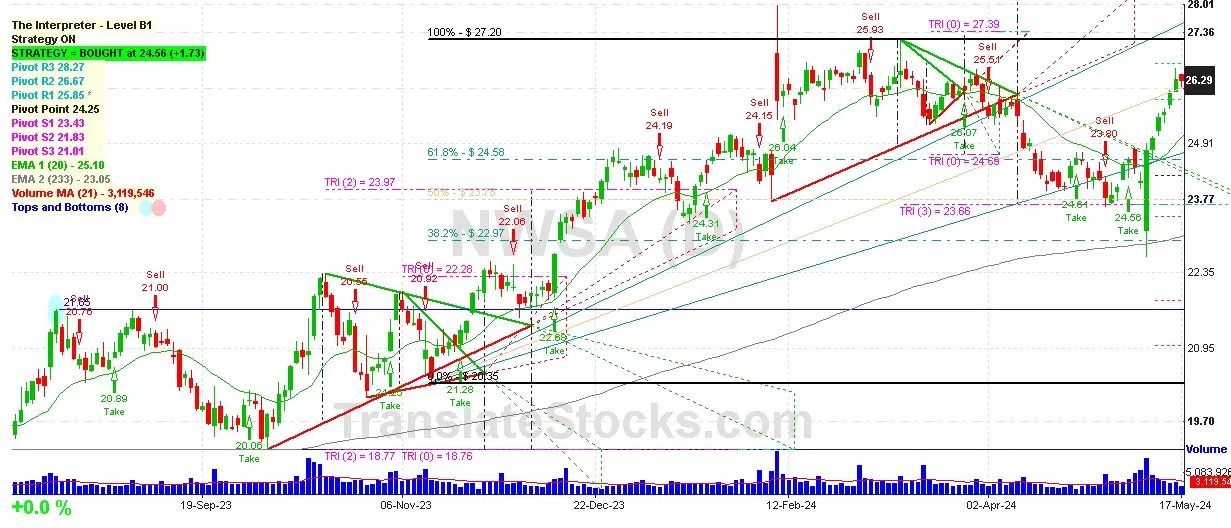
| 001 17 Apr 2024 | Buy Price: 24.15 | Profit: Open Day1 ($ 24.31) | Abandoned Baby | Buy |
| 002 03 Apr 2024 | Buy Price: 25.75 | Profit: Open Day1 ($ 25.86) | Engulfing | Buy |
| 003 28 Mar 2024 | Sell Price: 26.18 | Profit: Close Day1 ($ 25.81) | Engulfing | Sell |
| 004 12 Mar 2024 | Sell Price: 26.33 | Profit: Open Day2 ($ 26.26) | Engulfing | Sell |
| 005 12 Mar 2024 | Sell Price: 26.36 | Profit: Close Day1 ($ 26.35) | Dark Cloud Cover | Sell |
| 006 22 Feb 2024 | Buy Price: 26.51 | Loss: Close Day2 ($ 26.36) | Abandoned Baby | Buy |
| 007 20 Dec 2023 | Sell Price: 23.42 | Loss: Close Day2 ($ 23.80) | Engulfing | Sell |
| 008 13 Dec 2023 | Buy Price: 22.68 | Profit: Open Day1 ($ 22.97) | Engulfing | Buy |
| 009 12 Dec 2023 | Sell Price: 22.00 | Profit: Open Day1 ($ 21.98) | Engulfing | Sell |
| 010 02 Oct 2023 | Sell Price: 20.00 | Profit: Open Day1 ($ 19.89) | Abandoned Baby | Sell |
| 011 02 Oct 2023 | Sell Price: 19.99 | Profit: Open Day1 ($ 19.89) | Engulfing | Sell |
| 012 07 Sep 2023 | Sell Price: 21.00 | Loss: Close Day2 ($ 21.04) | Engulfing | Sell |
| 013 17 Aug 2023 | Sell Price: 20.78 | Profit: Open Day1 ($ 20.68) | Engulfing | Sell |
| 014One Year Average | Both Sides Result for 13 Signals |
Profit: $ 0.76 ($ 0.06 / Signal) |
All of Them | Buy + Sell |
| Simple Moving Averages (SMA) Period | Value $ | Signal | Exponential Moving Averages (EMA) Period | Value $ | Signal | |
|---|---|---|---|---|---|---|
| 2 | 26.30 | SELL | 2 | 26.24 | BUY | |
| 3 | 26.19 | BUY | 3 | 26.14 | BUY | |
| 5 | 25.92 | BUY | 5 | 25.90 | BUY | |
| 8 | 25.45 | BUY | 8 | 25.61 | BUY | |
| 13 | 24.99 | BUY | 13 | 25.29 | BUY | |
| 21 | 24.71 | BUY | 21 | 25.09 | BUY | |
| 34 | 24.80 | BUY | 34 | 25.04 | BUY | |
| 55 | 25.28 | BUY | 55 | 25.01 | BUY | |
| 90 | 25.24 | BUY | 90 | 24.73 | BUY | |
| 200 | 23.14 | BUY | 200 | 23.37 | BUY |
News Corp - Class A
IPO: 2013-06-19
Ticker: NWSAIndices: S&P 500,
Exchange: Nasdaq Nms - Global Market (US - USD)
Website: https://newscorp.com/
Phone:
Common Stock
Manufacturing (
Newspapers: Publishing Or Publishing & Printing
Year | 2021 | 2020 | 2019 | 2018 | 2017 | 2016 | 2015 | 2014 | 2013 | 2012 | 2011 | |
|---|---|---|---|---|---|---|---|---|---|---|---|---|
| 1 | Assets + | 16,771 | 14,261 | 15,711 | 16,346 | 14,552 | 15,483 | 15,093 | 16,489 | 15,643 | 3,721 | 2,022 |
| 2 | Real Estate Investment Property + | 131 | 123 | 146 | 150 | 153 | 153 | 161 | 177 | 185 | 0 | 0 |
| 3 | Real Estate Investment Property + | 131 | 123 | 146 | 150 | 153 | 153 | 161 | 177 | 185 | 0 | 0 |
| 4 | Investments in and Advance to Affiliates + | 71 | 120 | 148 | 173 | 1,205 | 0 | 0 | 0 | 0 | 0 | 0 |
| 5 | Cash and Cash Equivalents + | 2,236 | 1,517 | 1,643 | 2,034 | 2,016 | 1,832 | 1,951 | 3,145 | 2,381 | 1,133 | 2,022 |
| 6 | Property + | 2,272 | 2,256 | 2,554 | 2,560 | 1,624 | 2,405 | 2,746 | 3,009 | 2,992 | 0 | 0 |
| 7 | Property + | 3,620 | 3,197 | 5,909 | 5,767 | 4,871 | 4,818 | 5,163 | 5,528 | 5,127 | 0 | 0 |
| 8 | Intangible Assets + | 2,179 | 1,864 | 2,426 | 2,671 | 2,281 | 2,207 | 2,242 | 2,137 | 2,186 | 0 | 0 |
| 9 | Finite-Lived Intangible Assets + | 1,122 | 917 | 1,068 | 1,197 | 991 | 1,073 | 1,156 | 1,229 | 1,262 | 0 | 0 |
| 10 | Liabilities and Equity + | 16,771 | 14,261 | 15,711 | 16,346 | 14,552 | 15,483 | 15,093 | 16,489 | 15,643 | 8,919 | 12,429 |
| 11 | Liabilities + | 3,234 | 2,682 | 3,340 | 3,295 | 2,452 | 2,442 | 2,155 | 2,264 | 2,171 | 0 | 0 |
| 12 | Stockholders' Equity + | 9,146 | 8,389 | 10,311 | 10,477 | 11,073 | 11,782 | 12,116 | 13,399 | 12,676 | 8,919 | 12,429 |
| 13 | Stockholders' Equity Attributable to Parent + | 8,211 | 7,582 | 9,144 | 9,291 | 10,789 | 11,564 | 11,945 | 13,243 | 12,558 | 0 | 0 |
| 14 | Stockholders' Equity + | 0 | 0 | 0 | 0 | 0 | 0.02 | 0.02 | 0.02 | 0 | 0 | 0 |
| 15 | Preferred Stock + | 0 | 0 | 0 | 0 | 0 | 0.01 | 0.01 | 0.01 | 0 | 0 | 0 |
| 16 | Common Stock + | 0 | 0 | 0 | 0 | 0 | 0.01 | 0.01 | 0.01 | 0 | 0 | 0 |
| 17 | Partners' Capital + | -2,911 | -3,241 | -1,979 | -2,163 | -648 | 150 | 88 | 237 | 271 | 1,047 | 1,531 |
| 18 | Partners' Capital + | -2,911 | -3,241 | -1,979 | -2,163 | -648 | 150 | 88 | 237 | 271 | 1,047 | 1,531 |
| 19 | Limited Liability Company (LLC) Members' Equity + | -3,852 | -4,572 | -3,105 | -3,037 | -1,612 | -876 | -494 | 847 | 271 | 1,047 | 1,531 |
| 20 | Limited Liability Company (LLC) Members' Equity + | -3,852 | -4,572 | -3,105 | -3,037 | -1,612 | -876 | -494 | 847 | 271 | 1,047 | 1,531 |
| 21 | Current Assets + | 4,456 | 3,461 | 4,050 | 4,394 | 3,815 | 3,889 | 3,975 | 5,270 | 4,643 | 0 | 0 |
| 22 | Cash + | 280 | 177 | 187 | 220 | 0 | 315 | 0 | 0 | 0 | 0 | 0 |
| 23 | Current Receivables + | 1,498 | 1,203 | 1,544 | 1,612 | 82 | 55 | 63 | 1,388 | 1,335 | 0 | 0 |
| 24 | Inventory + | 253 | 348 | 348 | 376 | 208 | 218 | 319 | 310 | 301 | 0 | 0 |
| 25 | Current Disposal Group + | 0 | 0 | 0 | 0 | 0 | 0 | 0 | 0 | 89 | 0 | 0 |
| 26 | Long-Term Assets + | 7,761 | 6,588 | 6,463 | 6,184 | 4,297 | 4,114 | 3,787 | 3,531 | 3,323 | 2,588 | 0 |
| 27 | Long-term Investments and Receivables + | 351 | 297 | 335 | 393 | 2,027 | 2,270 | 2,418 | 2,692 | 2,607 | 0 | 0 |
| 28 | Current Liabilities + | 3,234 | 2,682 | 3,340 | 3,295 | 2,452 | 2,442 | 2,155 | 2,264 | 2,171 | 0 | 0 |
| 29 | Long-Term Liabilities + | 4,180 | 2,913 | 1,794 | 1,920 | 627 | 718 | 331 | 310 | 279 | 0 | 0 |
| 30 | Current Other Assets + | 469 | 393 | 515 | 372 | 523 | 513 | 651 | 671 | 680 | 0 | 0 |
| 31 | Total Current Assets + | 4,456 | 3,461 | 4,050 | 4,394 | 3,815 | 3,889 | 3,975 | 5,270 | 4,643 | 0 | 0 |
| 32 | Long-Term Inventory + | 279 | 133 | 155 | 143 | 31 | 0 | 0 | 0 | 0 | 0 | 0 |
| 33 | Operating Lease + | 1,035 | 1,061 | 0 | 0 | 0 | 0 | 0 | 0 | 0 | 0 | 0 |
| 34 | Goodwill + | 4,653 | 3,951 | 5,147 | 5,218 | 3,838 | 3,714 | 3,063 | 2,782 | 2,725 | 2,588 | 0 |
| 35 | Long-Term Other Assets + | 1,447 | 1,039 | 930 | 831 | 442 | 396 | 688 | 682 | 598 | 0 | 0 |
| 36 | Deferred Income Tax Assets + | 1,825 | 1,371 | 1,199 | 0 | 0 | 0 | 0 | 0 | 0 | 0 | 0 |
| 37 | Assets for Plan Benefits + | 1,945 | 1,465 | 1,316 | 966 | 459 | 400 | 724 | 749 | 0 | 0 | 0 |
| 38 | Long-Term Business Combination + | 2,073 | 1,576 | 0 | 0 | 0 | 0 | 0 | 0 | 0 | 0 | 0 |
| 39 | Total Assets + | 16,771 | 14,261 | 15,711 | 16,346 | 14,552 | 15,483 | 15,093 | 16,489 | 15,643 | 0 | 0 |
| 40 | Stockholders' Equity Attributable to Noncontrolling Interest + | 935 | 807 | 1,167 | 1,186 | 284 | 218 | 171 | 156 | 118 | 0 | 0 |
| 41 | Total Stockholders' Equity + | 9,146 | 8,389 | 10,311 | 10,477 | 11,073 | 11,782 | 12,116 | 13,399 | 12,676 | 8,919 | 12,429 |
| 42 | Total Liabilities and Equity + | 16,771 | 14,261 | 15,711 | 16,346 | 14,552 | 15,483 | 15,093 | 16,489 | 15,643 | 0 | 0 |
Year | 2021 | 2020 | 2019 | 2018 | 2017 | 2016 | 2015 | 2014 | 2013 | 2012 | |
|---|---|---|---|---|---|---|---|---|---|---|---|
| 1 | 9,358 | 9,008 | 10,074 | 9,024 | 8,139 | 8,292 | 8,633 | 8,574 | 8,891 | 8,654 | |
| 2 | 680 | 644 | 659 | 472 | 449 | 505 | 530 | 578 | 548 | 483 | |
| 3 | 168 | 1,830 | 188 | 351 | 927 | 89 | 455 | 94 | 1,737 | 2,763 | |
| 4 | 0 | 0 | 0 | 0 | 0 | -122 | 0 | 0 | 0 | 0 | |
| 5 | 4,831 | 5,000 | 5,622 | 4,903 | 4,529 | 4,728 | 5,025 | 5,139 | 5,420 | 5,122 | |
| 6 | 128 | 160 | 0 | 0 | 0 | 0 | 0 | 0 | 0 | 0 | |
| 7 | 3,254 | 2,995 | 3,208 | 3,049 | 2,725 | 2,722 | 2,756 | 2,665 | 2,783 | 2,750 | |
| 8 | 0 | 0 | -8,830 | 0 | 0 | 0 | 0 | 0 | 0 | 0 | |
| 9 | 143 | 9 | 33 | -325 | 132 | 18 | 75 | -653 | 1,593 | -59 | |
| 10 | -65 | -47 | -17 | -1,006 | -295 | 30 | 58 | 90 | 100 | 90 | |
| 11 | 450 | -1,524 | 354 | -1,089 | -615 | 181 | 56 | -397 | 173 | -2,377 | |
| 12 | -61 | -21 | -126 | -355 | -28 | 54 | -134 | 691 | 374 | 337 | |
| 13 | 0 | 0 | 0 | -1,799 | -671 | 289 | 233 | 1,127 | 0 | 0 | |
| 14 | 0 | 0 | 0 | 0 | 0 | 15 | -445 | -142 | 0 | 0 | |
| 15 | 389 | -1,545 | 228 | -1,444 | -643 | 250 | -78 | 294 | 547 | -2,040 | |
| 16 | -59 | 276 | -73 | -70 | -95 | -71 | -69 | -55 | -41 | -35 | |
| 17 | Total Net Income (Loss) Attributable to Parent + | 330 | -1,269 | 155 | -1,514 | -738 | 179 | -147 | 239 | 506 | -2,075 |
| 18 | Redeemable Preferred Stock Dividends + | 0 | 0 | 0 | 2 | 2 | 2 | 2 | 2 | 0 | 0 |
| 19 | 330 | -1,269 | 155 | -1,516 | -740 | 0 | 0 | 0 | 0 | 0 | |
| 20 | Income (Loss) from Continuing Operations + | 0 | 0 | 0 | -1,444 | -643 | 235 | 367 | 436 | 0 | 0 |
| 21 | Income (Loss) from Continuing Operations + | 0 | 0 | 0 | 0 | 0 | 306 | 436 | 491 | 0 | 0 |
| 22 | Total Income (Loss) from Continuing Operations + | 0 | 0 | 228 | -2,888 | -1,286 | 541 | 803 | 927 | 0 | 0 |
| 23 | Income (Loss) from Discontinued Operations + | 0 | 0 | 0 | 0 | 0 | 15 | -445 | -142 | 0 | 0 |
| 24 | Total Income (Loss) from Discontinued Operations + | 0 | 0 | 0 | 0 | 0 | 15 | -445 | -142 | 0 | 0 |
| 25 | Total Earnings Per Share + | 0.56 | -2.16 | 0.27 | -2.60 | -1.27 | -0.66 | -0.26 | 0.41 | 0.87 | -3.58 |
| 26 | Total Earnings Per Share + | 0.56 | -2.16 | 0.26 | -2.60 | -0.74 | -0.65 | -0.26 | 0.41 | 0.87 | -3.58 |
| 27 | Income (Loss) from Continuing Operations + | 0 | 0 | 0 | -2.60 | -1.27 | 0.28 | 0.51 | 0.65 | 0 | 0 |
| 28 | 0 | 0 | 0 | 0 | 0 | 0.02 | -0.77 | -0.24 | 0 | 0 | |
| 29 | Total Earnings Per Share + | 0 | 0 | -0.09 | -2.60 | -1.27 | 0.30 | -0.26 | 0.41 | 0.87 | 0 |
| 30 | 0 | 0 | 0 | 0.20 | 0.20 | 0.20 | 0 | 0 | 0 | 0 |

 Click to Enlarge