
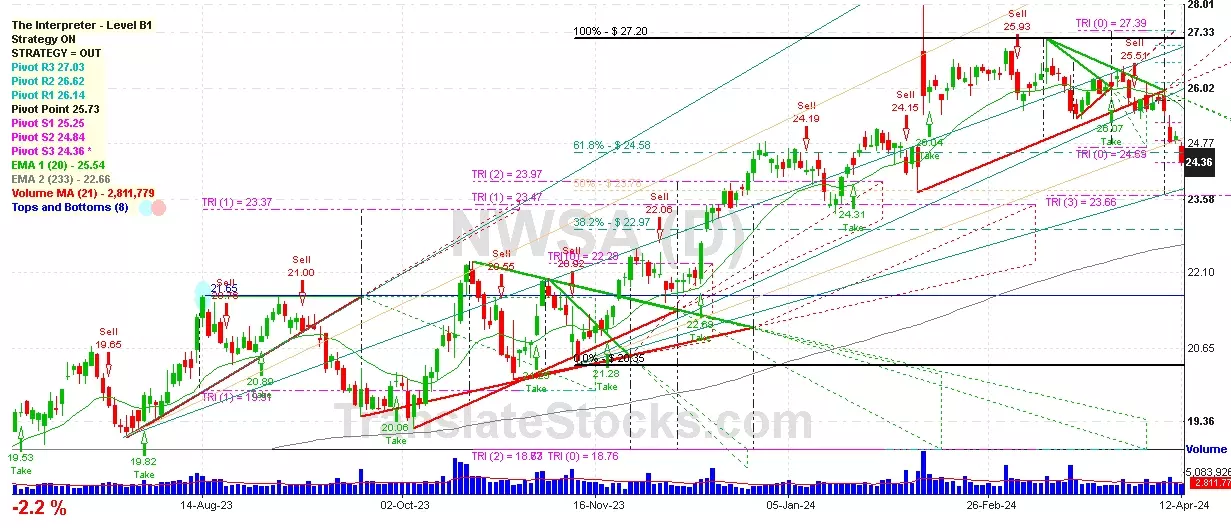
Hey Friend, I'm analysing NEWS CORP CLASS A (NWSA), and it is between the Support of $ 24.36 (PivotS3) and the Resistance of $ 24.58 (61.8% of Fibonacci). The stock is also approaching the line of PivotS3 at $ 24.36, and if it goes below this line it could reach the next Support of 50% of Fibonacci at $ 23.78. Since it is nailed exactly on the line of $ 24.36, we should wait for another day to better understand which side the stock will move to.

| Date | Price $ | Result % | Candle Name | Side |
|---|---|---|---|---|
| 001 17 Apr 2024 | Buy Price: 24.15 | Profit: Open Day1 ($ 24.31) | Abandoned Baby | Buy |
| 002 03 Apr 2024 | Buy Price: 25.75 | Profit: Open Day1 ($ 25.86) | Engulfing | Buy |
| 003 28 Mar 2024 | Sell Price: 26.18 | Profit: Close Day1 ($ 25.81) | Engulfing | Sell |
| 004 12 Mar 2024 | Sell Price: 26.33 | Profit: Open Day2 ($ 26.26) | Engulfing | Sell |
| 005 12 Mar 2024 | Sell Price: 26.36 | Profit: Close Day1 ($ 26.35) | Dark Cloud Cover | Sell |
| 006 22 Feb 2024 | Buy Price: 26.51 | Loss: Close Day2 ($ 26.36) | Abandoned Baby | Buy |
| 007 20 Dec 2023 | Sell Price: 23.42 | Loss: Close Day2 ($ 23.80) | Engulfing | Sell |
| 008 13 Dec 2023 | Buy Price: 22.68 | Profit: Open Day1 ($ 22.97) | Engulfing | Buy |
| 009 12 Dec 2023 | Sell Price: 22.00 | Profit: Open Day1 ($ 21.98) | Engulfing | Sell |
| 010 02 Oct 2023 | Sell Price: 20.00 | Profit: Open Day1 ($ 19.89) | Abandoned Baby | Sell |
| 011 02 Oct 2023 | Sell Price: 19.99 | Profit: Open Day1 ($ 19.89) | Engulfing | Sell |
| 012 07 Sep 2023 | Sell Price: 21.00 | Loss: Close Day2 ($ 21.04) | Engulfing | Sell |
| 013 17 Aug 2023 | Sell Price: 20.78 | Profit: Open Day1 ($ 20.68) | Engulfing | Sell |
| 014One Year Average | Both Sides Result for 13 Signals |
Profit: $ 0.76 ($ 0.06 / Signal) |
All of Them | Buy + Sell |
| Simple Moving Averages (SMA) Period | Value $ | Signal | Exponential Moving Averages (EMA) Period | Value $ | Signal | |
|---|---|---|---|---|---|---|
| 2 | 24.22 | BUY | 2 | 24.25 | SELL | |
| 3 | 24.33 | SELL | 3 | 24.29 | SELL | |
| 5 | 24.41 | SELL | 5 | 24.32 | SELL | |
| 8 | 24.28 | SELL | 8 | 24.37 | SELL | |
| 13 | 24.36 | SELL | 13 | 24.52 | SELL | |
| 21 | 24.88 | SELL | 21 | 24.77 | SELL | |
| 34 | 25.32 | SELL | 34 | 25.01 | SELL | |
| 55 | 25.66 | SELL | 55 | 25.04 | SELL | |
| 90 | 25.12 | SELL | 90 | 24.65 | SELL | |
| 200 | 22.76 | BUY | 200 | 23.13 | BUY |
News Corp - Class A
IPO: 2013-06-19
Ticker: NWSAIndices: S&P 500,
Exchange: Nasdaq Nms - Global Market (US - USD)
Website: https://newscorp.com/
Phone:
Common Stock
Manufacturing (
Newspapers: Publishing Or Publishing & Printing
 Click to Enlarge