| Date | Price $ | Result % | Candle Name | Side |
|---|---|---|---|---|
| 001 14 May 2024 | Sell Price: 97.89 | Loss: Close Day2 ($ 100.74) | Engulfing | Sell |
| 002 24 Apr 2024 | Sell Price: 93.76 | Profit: Open Day1 ($ 91.54) | Dark Cloud Cover | Sell |
| 003 20 Mar 2024 | Buy Price: 105.50 | Profit: Open Day1 ($ 107.07) | Abandoned Baby | Buy |
| 004 13 Mar 2024 | Buy Price: 109.66 | Loss: Close Day2 ($ 106.10) | Engulfing | Buy |
| 005 08 Mar 2024 | Sell Price: 110.30 | Profit: Open Day1 ($ 109.00) | Dark Cloud Cover | Sell |
| 006 22 Feb 2024 | Buy Price: 82.30 | Profit: Open Day1 ($ 82.98) | Abandoned Baby | Buy |
| 007 16 Feb 2024 | Sell Price: 88.86 | Profit: Open Day1 ($ 86.95) | Engulfing | Sell |
| 008 24 Jan 2024 | Sell Price: 85.06 | Profit: Close Day1 ($ 84.51) | Engulfing | Sell |
| 009 28 Nov 2023 | Buy Price: 72.61 | Loss: Close Day2 ($ 67.05) | Engulfing | Buy |
| 010 22 Nov 2023 | Buy Price: 71.93 | Profit: Close Day1 ($ 73.25) | Engulfing | Buy |
| 011 16 Nov 2023 | Sell Price: 69.62 | Profit: Open Day1 ($ 69.49) | Abandoned Baby | Sell |
| 012 02 Nov 2023 | Sell Price: 67.99 | Profit: Close Day2 ($ 67.76) | Dark Cloud Cover | Sell |
| 013 24 Oct 2023 | Buy Price: 71.91 | Loss: Close Day2 ($ 67.70) | Abandoned Baby | Buy |
| 014 06 Oct 2023 | Buy Price: 80.42 | Profit: Close Day1 ($ 83.50) | Engulfing | Buy |
| 015 27 Sep 2023 | Buy Price: 80.70 | Profit: Close Day1 ($ 81.46) | Abandoned Baby | Buy |
| 016 24 Aug 2023 | Sell Price: 71.37 | Profit: Open Day1 ($ 71.28) | Engulfing | Sell |
| 017 22 Aug 2023 | Sell Price: 71.38 | Profit: Close Day2 ($ 71.37) | Engulfing | Sell |
| 018 18 Aug 2023 | Buy Price: 71.73 | Profit: Open Day1 ($ 71.88) | Piercing Line | Buy |
| 019 27 Jul 2023 | Sell Price: 70.31 | Loss: Close Day2 ($ 76.86) | Engulfing | Sell |
| 020 21 Jul 2023 | Buy Price: 70.00 | Profit: Open Day1 ($ 70.20) | Abandoned Baby | Buy |
| 021 14 Jul 2023 | Sell Price: 70.69 | Loss: Close Day2 ($ 70.84) | Engulfing | Sell |
| 022 05 Jul 2023 | Buy Price: 70.34 | Loss: Close Day2 ($ 68.53) | Engulfing | Buy |
| 023One Year Average | Both Sides Result for 22 Signals |
Loss: $ -10.49 ($ -0.48 / Signal) |
All of Them | Buy + Sell |
| Simple Moving Averages (SMA) Period | Value $ | Signal | Exponential Moving Averages (EMA) Period | Value $ | Signal | |
|---|---|---|---|---|---|---|
| 2 | 101.85 | BUY | 2 | 102.01 | BUY | |
| 3 | 100.99 | BUY | 3 | 101.32 | BUY | |
| 5 | 99.85 | BUY | 5 | 100.40 | BUY | |
| 8 | 99.04 | BUY | 8 | 99.48 | BUY | |
| 13 | 98.12 | BUY | 13 | 98.53 | BUY | |
| 21 | 96.20 | BUY | 21 | 97.97 | BUY | |
| 34 | 97.16 | BUY | 34 | 97.75 | BUY | |
| 55 | 100.89 | BUY | 55 | 96.86 | BUY | |
| 90 | 94.77 | BUY | 90 | 94.40 | BUY | |
| 200 | 85.25 | BUY | 200 | 88.77 | BUY |
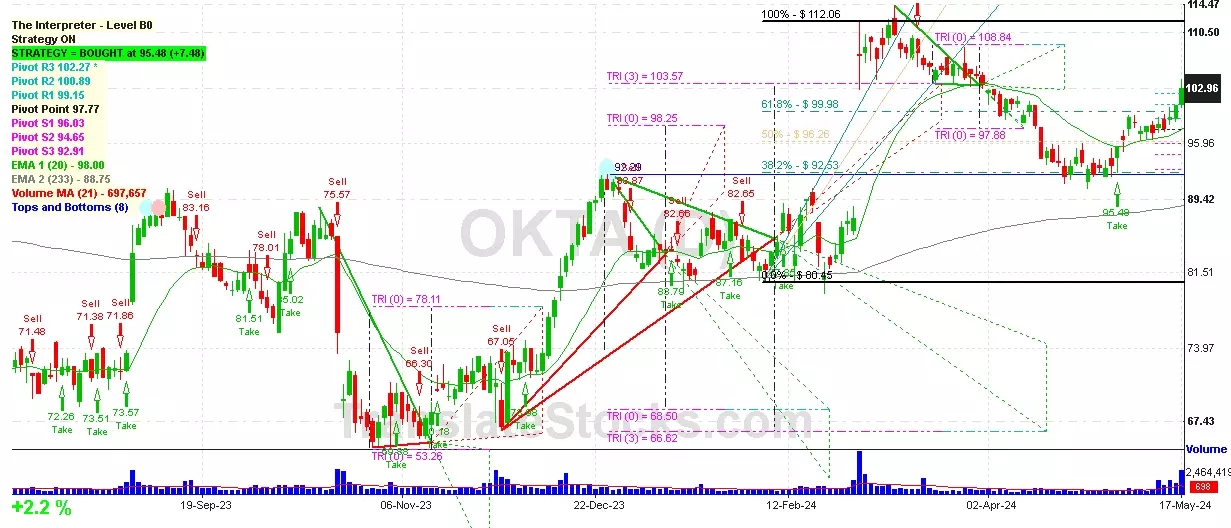
Okta Inc
IPO: 2017-04-07
Ticker: OKTAIndices: Nasdaq 100,
Exchange: Nasdaq Nms - Global Market (US - USD)
Website: https://www.okta.com/
Phone:
Common Stock
Technology (
Services-prepackaged Software

 Click to Enlarge