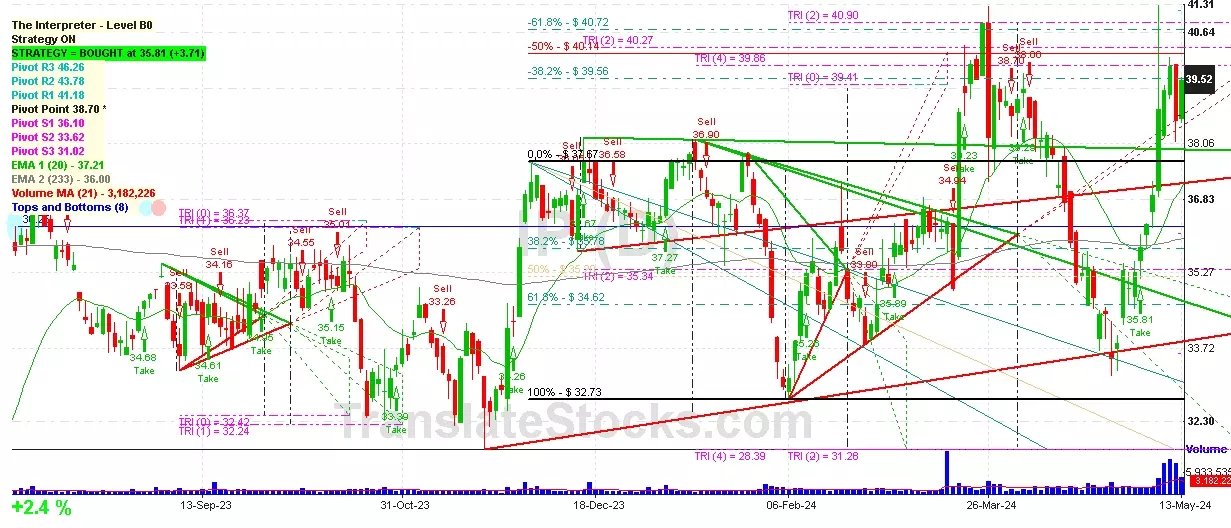
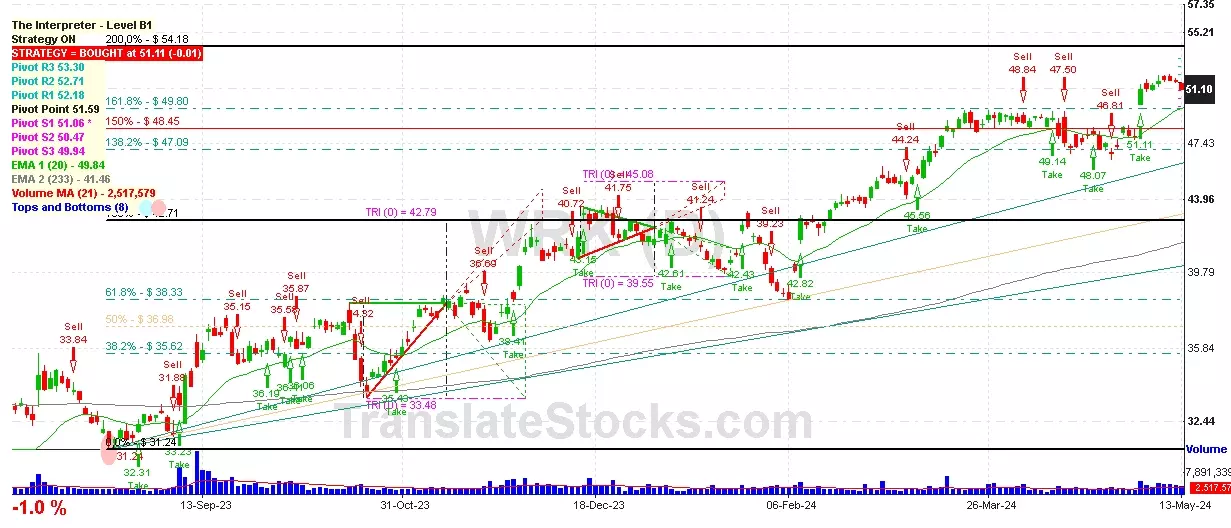
Hey Friend, I'm analysing WESTROCK CO (WRK), and it is between the Support of $ 51.06 (PivotS1) and the Resistance of $ 51.59 (Pivot). The stock is also approaching the line of PivotS1 at $ 51.06, and if it goes below this line it could reach the next Support of 161.8% of Fibonacci at $ 50.69.

| Date | Price $ | Result % | Candle Name | Side |
|---|---|---|---|---|
| 001 02 May 2024 | Buy Price: 51.11 | Profit: Open Day1 ($ 51.54) | Abandoned Baby | Buy |
| 002 26 Apr 2024 | Buy Price: 47.25 | Profit: Open Day1 ($ 48.18) | Abandoned Baby | Buy |
| 003 28 Mar 2024 | Buy Price: 49.45 | Loss: Close Day2 ($ 49.27) | Engulfing | Buy |
| 004 01 Mar 2024 | Sell Price: 45.02 | Profit: Close Day1 ($ 44.97) | Abandoned Baby | Sell |
| 005 21 Feb 2024 | Sell Price: 43.75 | Loss: Close Day2 ($ 43.91) | Dark Cloud Cover | Sell |
| 006 12 Jan 2024 | Buy Price: 41.69 | Loss: Close Day2 ($ 40.49) | Abandoned Baby | Buy |
| 007 26 Dec 2023 | Buy Price: 42.13 | Profit: Close Day1 ($ 42.75) | Engulfing | Buy |
| 008 13 Dec 2023 | Buy Price: 41.75 | Profit: Open Day1 ($ 43.05) | Engulfing | Buy |
| 009 15 Sep 2023 | Sell Price: 36.53 | Loss: Close Day2 ($ 36.89) | Engulfing | Sell |
| 010 04 Aug 2023 | Sell Price: 33.89 | Loss: Close Day2 ($ 34.79) | Engulfing | Sell |
| 011 26 Jun 2023 | Buy Price: 28.41 | Profit: Open Day1 ($ 28.47) | Abandoned Baby | Buy |
| 012 13 Jun 2023 | Buy Price: 29.69 | Profit: Open Day1 ($ 29.88) | Abandoned Baby | Buy |
| 013 31 May 2023 | Sell Price: 28.01 | Profit: Close Day1 ($ 27.52) | Abandoned Baby | Sell |
| 014One Year Average | Both Sides Result for 13 Signals |
Profit: $ 1.27 ($ 0.10 / Signal) |
All of Them | Buy + Sell |
| Simple Moving Averages (SMA) Period | Value $ | Signal | Exponential Moving Averages (EMA) Period | Value $ | Signal | |
|---|---|---|---|---|---|---|
| 2 | 51.67 | SELL | 2 | 51.66 | SELL | |
| 3 | 51.72 | SELL | 3 | 51.63 | BUY | |
| 5 | 51.63 | BUY | 5 | 51.40 | BUY | |
| 8 | 51.04 | BUY | 8 | 50.93 | BUY | |
| 13 | 49.72 | BUY | 13 | 50.29 | BUY | |
| 21 | 48.91 | BUY | 21 | 49.64 | BUY | |
| 34 | 48.99 | BUY | 34 | 48.88 | BUY | |
| 55 | 47.98 | BUY | 55 | 47.74 | BUY | |
| 90 | 45.47 | BUY | 90 | 45.96 | BUY | |
| 200 | 40.57 | BUY | 200 | 42.04 | BUY |
Westrock Co
IPO: 2015-06-24
Ticker: WRKIndices: S&P 500,
Exchange: New York Stock Exchange, Inc. (US - USD)
Website: https://www.westrock.com/
Phone:
Common Stock
Manufacturing (
Paperboard Containers & Boxes
Year | 2021 | 2020 | 2019 | 2018 | 2017 | 2016 | |
|---|---|---|---|---|---|---|---|
| 1 | Assets + | 29,254 | 28,780 | 30,157 | 25,360 | 25,089 | 23,038 |
| 2 | Investments in and Advance to Affiliates + | 453 | 430 | 469 | 458 | 361 | 329 |
| 3 | Cash and Cash Equivalents + | 291 | 251 | 152 | 637 | 298 | 0 |
| 4 | Property + | 10,570 | 10,779 | 11,190 | 9,082 | 9,118 | 0 |
| 5 | Property + | 18,719 | 17,916 | 17,461 | 14,420 | 13,682 | 0 |
| 6 | Intangible Assets + | 3,319 | 3,667 | 4,060 | 3,122 | 3,329 | 0 |
| 7 | Finite-Lived Intangible Assets + | 3,319 | 3,668 | 4,059 | 3,122 | 3,329 | 0 |
| 8 | Liabilities and Equity + | 29,254 | 28,780 | 30,157 | 25,360 | 25,089 | 9,830 |
| 9 | Liabilities + | 3,644 | 2,929 | 3,435 | 3,333 | 3,010 | 0 |
| 10 | Temporary Equity + | 2 | 1 | 2 | 4 | 5 | 0 |
| 11 | Redeemable Noncontrolling Interest + | 2 | 1 | 2 | 4 | 5 | 0 |
| 12 | Stockholders' Equity + | 11,690 | 10,648 | 11,684 | 11,482 | 10,386 | 9,830 |
| 13 | Stockholders' Equity Attributable to Parent + | 11,670 | 10,631 | 11,670 | 11,469 | 10,342 | 9,729 |
| 14 | Stockholders' Equity + | 0.02 | 0.02 | 0.02 | 0.02 | 0.02 | 0 |
| 15 | Preferred Stock + | 0.01 | 0.01 | 0.01 | 0.01 | 0.01 | 0 |
| 16 | Common Stock + | 0.01 | 0.01 | 0.01 | 0.01 | 0.01 | 0 |
| 17 | Partners' Capital + | 1,608 | 1,032 | 1,997 | 1,573 | 172 | -626 |
| 18 | Partners' Capital + | 1,608 | 1,032 | 1,997 | 1,573 | 172 | -626 |
| 19 | Limited Liability Company (LLC) Members' Equity + | 609 | -288 | 928 | 878 | -285 | -626 |
| 20 | Limited Liability Company (LLC) Members' Equity + | 609 | -288 | 928 | 878 | -285 | -626 |
| 21 | Current Assets + | 5,660 | 4,945 | 4,974 | 4,785 | 4,491 | 20 |
| 22 | Cash + | 0 | 0 | 0 | 0 | 6 | 0 |
| 23 | Current Receivables + | 2,587 | 2,143 | 2,193 | 2,011 | 1,887 | 0 |
| 24 | Inventory + | 2,173 | 2,023 | 2,108 | 1,830 | 1,797 | 0 |
| 25 | Current Contract with Customer + | 199 | 186 | 188 | 184 | 0 | 0 |
| 26 | Current Disposal Group + | 11 | 7 | 26 | 60 | 174 | 20 |
| 27 | Long-Term Assets + | 9,147 | 8,814 | 8,694 | 7,090 | 6,863 | 4,778 |
| 28 | Current Liabilities + | 3,644 | 2,929 | 3,435 | 3,333 | 3,010 | 0 |
| 29 | Long-Term Liabilities + | 12,940 | 14,161 | 13,434 | 6,669 | 6,683 | 0 |
| 30 | Current Other Assets + | 598 | 520 | 496 | 248 | 329 | 0 |
| 31 | Total Current Assets + | 5,660 | 4,945 | 4,974 | 4,785 | 4,491 | 0 |
| 32 | Operating Lease + | 676 | 659 | 0 | 0 | 0 | 0 |
| 33 | Goodwill + | 5,959 | 5,962 | 7,286 | 5,578 | 5,528 | 4,778 |
| 34 | Long-Term Other Assets + | 1,812 | 1,790 | 1,149 | 1,092 | 967 | 0 |
| 35 | Deferred Income Tax Assets + | 1,838 | 1,824 | 1,183 | 0 | 0 | 0 |
| 36 | Assets for Plan Benefits + | 2,512 | 2,193 | 1,408 | 1,512 | 1,335 | 0 |
| 37 | Total Assets + | 29,254 | 28,780 | 30,157 | 25,360 | 25,089 | 23,038 |
| 38 | Stockholders' Equity Attributable to Noncontrolling Interest + | 20 | 17 | 14 | 13 | 44 | 0 |
| 39 | Total Stockholders' Equity + | 11,690 | 10,648 | 11,684 | 11,482 | 10,386 | 9,830 |
| 40 | Total Liabilities and Equity + | 29,254 | 28,780 | 30,157 | 25,360 | 25,089 | 0 |
Year | 2021 | 2020 | 2019 | 2018 | 2017 | 2016 | |
|---|---|---|---|---|---|---|---|
| 1 | 18,746 | 17,579 | 0 | 0 | 0 | 0 | |
| 2 | 0 | 0 | 4,652 | 4,237 | 14,860 | 14,172 | |
| 3 | -15,316 | -14,382 | -14,540 | -12,923 | -12,142 | -11,413 | |
| 4 | 3,430 | 3,197 | 3,749 | 3,362 | 0 | 0 | |
| 5 | 0 | 0 | 28 | 38 | 27 | 9 | |
| 6 | 2 | 19 | 34 | 22 | 41 | 60 | |
| 7 | 0 | 0 | 347 | 244 | 0 | 0 | |
| 8 | -4 | 13 | 43 | -3 | 8 | 0 | |
| 9 | 0 | 0 | 0 | 0 | 193 | 0 | |
| 10 | 4 | -16 | -41 | 10 | 198 | 0 | |
| 11 | 1,281 | -256 | 1,494 | 1,187 | 783 | 430 | |
| 12 | 135 | 103 | 74 | 95 | 52 | 0 | |
| 13 | 11 | 10 | 2 | 13 | 12 | 0 | |
| 14 | 0 | 0 | 0 | 13 | 12 | 14 | |
| 15 | 7 | 8 | 0 | 0 | 0 | 0 | |
| 16 | 419 | 466 | 489 | 353 | 0 | 0 | |
| 17 | 10 | 2 | 5 | 0 | -2 | -3 | |
| 18 | 41 | 16 | 10 | 34 | 39 | 10 | |
| 19 | 1,086 | -523 | 1,145 | 1,035 | 858 | 245 | |
| 20 | -243 | -164 | -277 | 874 | -159 | -90 | |
| 21 | 0 | 0 | 0 | 2,783 | 540 | 65 | |
| 22 | 0 | 0 | 0 | 0 | 0 | 32 | |
| 23 | 0 | 0 | 0 | 0 | 0 | -545 | |
| 24 | 842 | -686 | 868 | 1,909 | 699 | -390 | |
| 25 | -4 | -5 | -5 | -3 | 10 | -6 | |
| 26 | Total Net Income (Loss) Attributable to Parent + | 838 | -691 | 863 | 1,906 | 708 | -396 |
| 27 | 838 | -691 | 863 | 1,906 | 708 | -396 | |
| 28 | Income (Loss) from Continuing Operations + | 0 | 0 | 0 | 1,909 | 699 | 155 |
| 29 | Income (Loss) from Continuing Operations + | 0 | 0 | 0 | 1,912 | 689 | 157 |
| 30 | Total Income (Loss) from Continuing Operations + | 0 | 0 | 0 | 3,818 | 1,397 | 310 |
| 31 | Income (Loss) from Discontinued Operations + | 0 | 0 | 0 | 0 | 0 | -545 |
| 32 | Income (Loss) from Discontinued Operations + | 0 | 0 | 0 | 0 | 0 | -541 |
| 33 | Total Income (Loss) from Discontinued Operations + | 0 | 0 | 0 | 0 | 0 | -549 |
| 34 | Income (Loss) from Continuing Operations + | 0 | 0 | 0 | 7.46 | 2.81 | 0.60 |
| 35 | 0 | 0 | 0 | 0 | 0 | -2.16 | |
| 36 | Total Earnings Per Share + | 3.16 | -2.67 | 3.36 | 7.46 | 2.81 | -1.56 |
| 37 | Income (Loss) from Continuing Operations + | 0 | 0 | 0 | 7.46 | 2.81 | 0.60 |
| 38 | Income (Loss) from Continuing Operations + | 0 | 0 | 0 | 7.34 | 2.77 | 0.59 |
| 39 | 0 | 0 | 0 | 0 | 0 | -2.13 | |
| 40 | Total Earnings Per Share + | 3.13 | -2.67 | 3.33 | 7.34 | 2.77 | -1.54 |
| 41 | 0.88 | 1.33 | 1.82 | 1.72 | 1.60 | 1.50 |
 Click to Enlarge