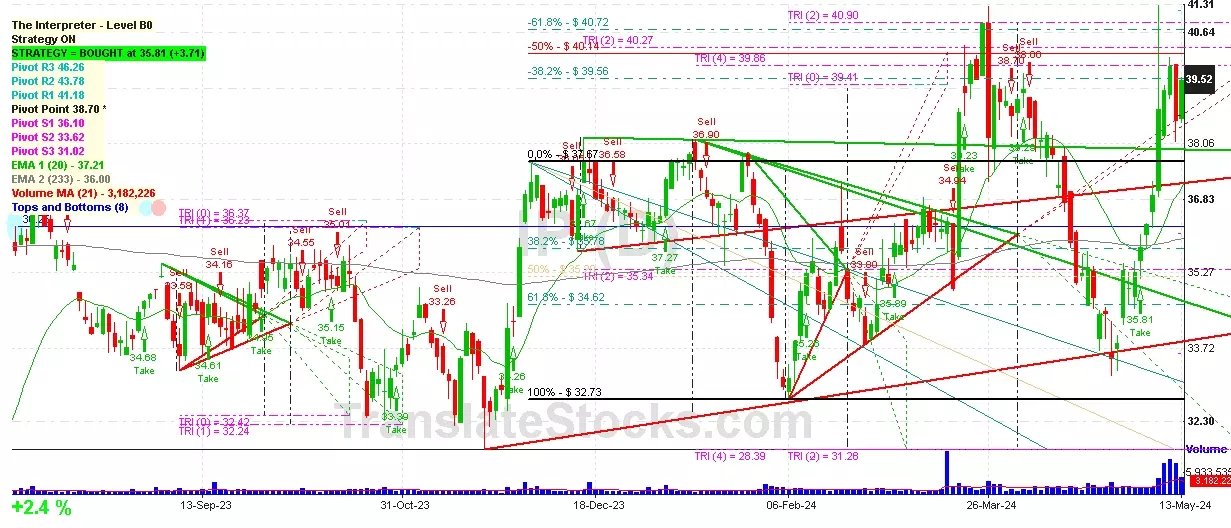
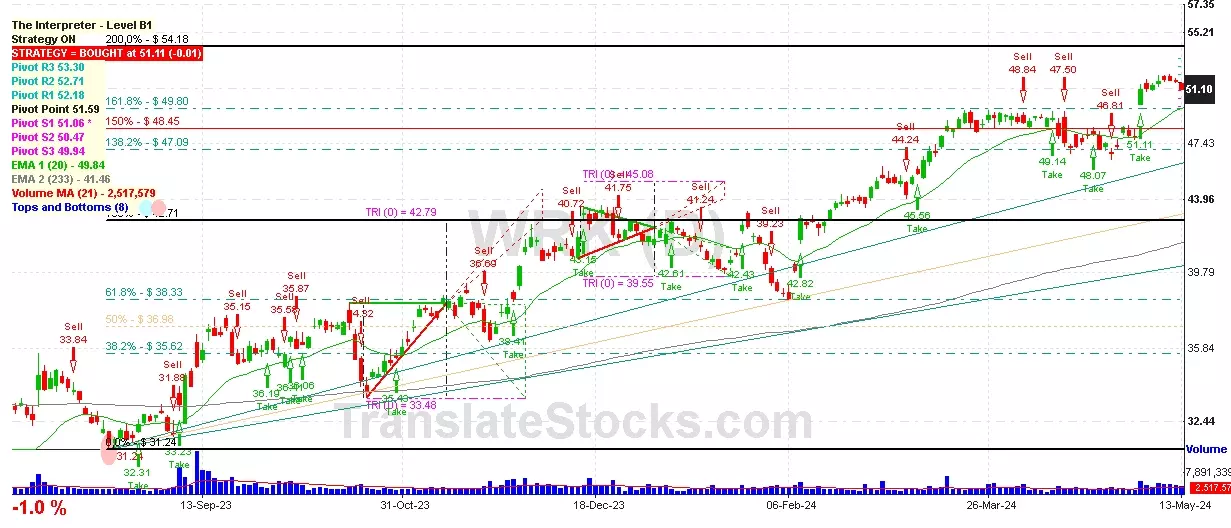
Hey Friend, I'm analysing WESTROCK CO (WRK), and it is between the Support of $ 51.06 (PivotS1) and the Resistance of $ 51.59 (Pivot). The stock is also approaching the line of PivotS1 at $ 51.06, and if it goes below this line it could reach the next Support of 161.8% of Fibonacci at $ 50.69.

| Date | Price $ | Result % | Candle Name | Side |
|---|---|---|---|---|
| 001 02 May 2024 | Buy Price: 51.11 | Profit: Open Day1 ($ 51.54) | Abandoned Baby | Buy |
| 002 26 Apr 2024 | Buy Price: 47.25 | Profit: Open Day1 ($ 48.18) | Abandoned Baby | Buy |
| 003 28 Mar 2024 | Buy Price: 49.45 | Loss: Close Day2 ($ 49.27) | Engulfing | Buy |
| 004 01 Mar 2024 | Sell Price: 45.02 | Profit: Close Day1 ($ 44.97) | Abandoned Baby | Sell |
| 005 21 Feb 2024 | Sell Price: 43.75 | Loss: Close Day2 ($ 43.91) | Dark Cloud Cover | Sell |
| 006 12 Jan 2024 | Buy Price: 41.69 | Loss: Close Day2 ($ 40.49) | Abandoned Baby | Buy |
| 007 26 Dec 2023 | Buy Price: 42.13 | Profit: Close Day1 ($ 42.75) | Engulfing | Buy |
| 008 13 Dec 2023 | Buy Price: 41.75 | Profit: Open Day1 ($ 43.05) | Engulfing | Buy |
| 009 15 Sep 2023 | Sell Price: 36.53 | Loss: Close Day2 ($ 36.89) | Engulfing | Sell |
| 010 04 Aug 2023 | Sell Price: 33.89 | Loss: Close Day2 ($ 34.79) | Engulfing | Sell |
| 011 26 Jun 2023 | Buy Price: 28.41 | Profit: Open Day1 ($ 28.47) | Abandoned Baby | Buy |
| 012 13 Jun 2023 | Buy Price: 29.69 | Profit: Open Day1 ($ 29.88) | Abandoned Baby | Buy |
| 013 31 May 2023 | Sell Price: 28.01 | Profit: Close Day1 ($ 27.52) | Abandoned Baby | Sell |
| 014One Year Average | Both Sides Result for 13 Signals |
Profit: $ 1.27 ($ 0.10 / Signal) |
All of Them | Buy + Sell |
| Simple Moving Averages (SMA) Period | Value $ | Signal | Exponential Moving Averages (EMA) Period | Value $ | Signal | |
|---|---|---|---|---|---|---|
| 2 | 51.37 | SELL | 2 | 51.29 | SELL | |
| 3 | 51.48 | SELL | 3 | 51.36 | SELL | |
| 5 | 51.57 | SELL | 5 | 51.30 | SELL | |
| 8 | 51.44 | SELL | 8 | 50.97 | BUY | |
| 13 | 50.00 | BUY | 13 | 50.40 | BUY | |
| 21 | 49.05 | BUY | 21 | 49.77 | BUY | |
| 34 | 49.06 | BUY | 34 | 49.01 | BUY | |
| 55 | 48.11 | BUY | 55 | 47.86 | BUY | |
| 90 | 45.58 | BUY | 90 | 46.07 | BUY | |
| 200 | 40.67 | BUY | 200 | 42.13 | BUY |
Westrock Co
IPO: 2015-06-24
Ticker: WRKIndices: S&P 500,
Exchange: New York Stock Exchange, Inc. (US - USD)
Website: https://www.westrock.com/
Phone:
Common Stock
Manufacturing (
Paperboard Containers & Boxes
 Click to Enlarge