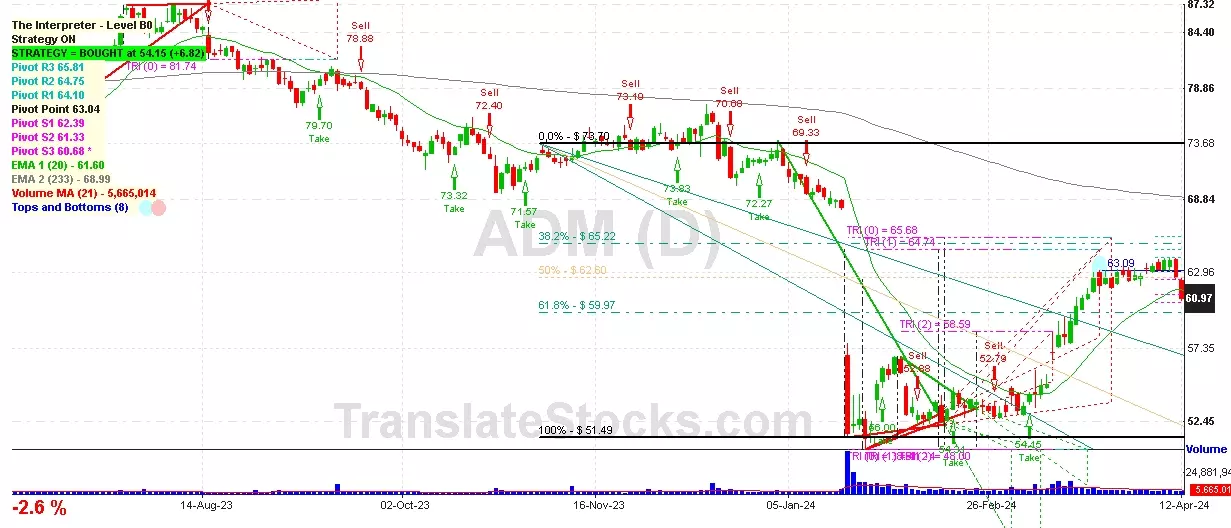
Hey Friend, I'm analysing ARCHER DANIELS MIDLAND CO (ADM), and it is between the Support of $ 60.68 (PivotS3) and the Resistance of $ 61.33 (PivotS2). The stock is also approaching the line of PivotS3 at $ 60.68, and if it goes below this line it could reach the next Support of 61.8% of Fibonacci at $ 59.97.

| Date | Price $ | Result % | Candle Name | Side |
|---|---|---|---|---|
| 001 22 Mar 2024 | Sell Price: 62.00 | Profit: Close Day2 ($ 61.81) | Dark Cloud Cover | Sell |
| 002 04 Jan 2024 | Sell Price: 71.75 | Profit: Open Day1 ($ 71.37) | Engulfing | Sell |
| 003 01 Nov 2023 | Sell Price: 71.37 | Loss: Close Day2 ($ 72.91) | Engulfing | Sell |
| 004 24 May 2023 | Sell Price: 72.85 | Profit: Open Day1 ($ 72.20) | Engulfing | Sell |
| 005 05 May 2023 | Buy Price: 75.96 | Profit: Open Day1 ($ 76.28) | Abandoned Baby | Buy |
| 006One Year Average | Both Sides Result for 5 Signals | Result is 0 (zero). And Even is a Loss | All of Them | Buy + Sell |
| Simple Moving Averages (SMA) Period | Value $ | Signal | Exponential Moving Averages (EMA) Period | Value $ | Signal | |
|---|---|---|---|---|---|---|
| 2 | 61.27 | SELL | 2 | 61.22 | SELL | |
| 3 | 61.44 | SELL | 3 | 61.38 | SELL | |
| 5 | 61.89 | SELL | 5 | 61.52 | SELL | |
| 8 | 61.48 | SELL | 8 | 61.63 | SELL | |
| 13 | 61.82 | SELL | 13 | 61.70 | SELL | |
| 21 | 62.24 | SELL | 21 | 61.48 | SELL | |
| 34 | 61.21 | SELL | 34 | 60.94 | BUY | |
| 55 | 58.24 | BUY | 55 | 60.89 | BUY | |
| 90 | 60.96 | BUY | 90 | 62.27 | SELL | |
| 200 | 70.04 | SELL | 200 | 67.35 | SELL |
Archer-daniels-midland Co
IPO: 1924-12-24
Ticker: ADMIndices: S&P 500,
Exchange: New York Stock Exchange, Inc. (US - USD)
Website: https://www.adm.com/
Phone:
Common Stock
Manufacturing (
Fats & Oils
 Click to Enlarge