
| Date | Price $ | Result % | Candle Name | Side |
|---|---|---|---|---|
| 001 18 Mar 2024 | Buy Price: 104.77 | Loss: Close Day2 ($ 103.89) | Abandoned Baby | Buy |
| 002 14 Mar 2024 | Sell Price: 104.64 | Profit: Open Day1 ($ 103.94) | Abandoned Baby | Sell |
| 003 06 Mar 2024 | Buy Price: 99.38 | Loss: Close Day2 ($ 98.27) | Abandoned Baby | Buy |
| 004 26 Feb 2024 | Sell Price: 110.59 | Profit: Open Day2 ($ 107.85) | Abandoned Baby | Sell |
| 005 13 Feb 2024 | Sell Price: 103.81 | Loss: Close Day2 ($ 106.84) | Abandoned Baby | Sell |
| 006 07 Feb 2024 | Sell Price: 105.30 | Profit: Open Day1 ($ 104.62) | Abandoned Baby | Sell |
| 007 29 Jan 2024 | Buy Price: 107.76 | Loss: Close Day2 ($ 105.31) | Abandoned Baby | Buy |
| 008 25 Jan 2024 | Sell Price: 108.61 | Profit: Open Day1 ($ 106.92) | Abandoned Baby | Sell |
| 009 23 Jan 2024 | Buy Price: 107.19 | Profit: Open Day1 ($ 110.79) | Abandoned Baby | Buy |
| 010 18 Jan 2024 | Buy Price: 103.64 | Loss: Close Day2 ($ 99.72) | Abandoned Baby | Buy |
| 011 03 Jan 2024 | Buy Price: 117.69 | Profit: Close Day1 ($ 118.32) | Engulfing | Buy |
| 012 02 Jan 2024 | Sell Price: 115.34 | Profit: Open Day1 ($ 113.81) | Abandoned Baby | Sell |
| 013 18 Dec 2023 | Sell Price: 112.26 | Profit: Close Day2 ($ 111.23) | Abandoned Baby | Sell |
| 014 14 Dec 2023 | Buy Price: 112.91 | Profit: Open Day1 ($ 115.93) | Engulfing | Buy |
| 015 30 Nov 2023 | Buy Price: 118.66 | Loss: Close Day2 ($ 113.70) | Abandoned Baby | Buy |
| 016 20 Nov 2023 | Buy Price: 111.29 | Profit: Close Day1 ($ 113.42) | Abandoned Baby | Buy |
| 017 16 Nov 2023 | Sell Price: 109.29 | Profit: Open Day1 ($ 108.30) | Abandoned Baby | Sell |
| 018 10 Nov 2023 | Buy Price: 105.94 | Profit: Open Day1 ($ 107.60) | Piercing Line | Buy |
| 019 06 Nov 2023 | Sell Price: 108.40 | Profit: Open Day1 ($ 108.13) | Engulfing | Sell |
| 020 11 Oct 2023 | Sell Price: 134.12 | Profit: Open Day1 ($ 133.62) | Dark Cloud Cover | Sell |
| 021 05 Oct 2023 | Buy Price: 130.10 | Profit: Close Day1 ($ 134.76) | Abandoned Baby | Buy |
| 022 02 Oct 2023 | Sell Price: 133.05 | Profit: Open Day1 ($ 131.00) | Abandoned Baby | Sell |
| 023 22 Sep 2023 | Buy Price: 132.35 | Loss: Close Day2 ($ 131.01) | Abandoned Baby | Buy |
| 024 11 Sep 2023 | Buy Price: 138.14 | Profit: Open Day1 ($ 138.64) | Abandoned Baby | Buy |
| 025 22 Aug 2023 | Buy Price: 128.36 | Profit: Open Day1 ($ 129.72) | Abandoned Baby | Buy |
| 026 03 Aug 2023 | Buy Price: 149.93 | Loss: Close Day2 ($ 147.00) | Abandoned Baby | Buy |
| 027 01 Aug 2023 | Sell Price: 153.19 | Profit: Open Day1 ($ 149.00) | Abandoned Baby | Sell |
| 028 24 Jul 2023 | Buy Price: 148.73 | Profit: Open Day1 ($ 151.00) | Engulfing | Buy |
| 029 07 Jul 2023 | Buy Price: 142.66 | Profit: Close Day1 ($ 142.95) | Abandoned Baby | Buy |
| 030 28 Jun 2023 | Sell Price: 141.79 | Profit: Open Day1 ($ 137.03) | Abandoned Baby | Sell |
| 031 05 Jun 2023 | Sell Price: 132.27 | Loss: Close Day2 ($ 132.79) | Abandoned Baby | Sell |
| 032 22 May 2023 | Buy Price: 125.95 | Loss: Close Day2 ($ 119.11) | Abandoned Baby | Buy |
| 033 04 May 2023 | Buy Price: 121.35 | Profit: Open Day1 ($ 122.49) | Abandoned Baby | Buy |
| 034One Year Average | Both Sides Result for 33 Signals |
Profit: $ 14.41 ($ 0.44 / Signal) |
All of Them | Buy + Sell |
| Simple Moving Averages (SMA) Period | Value $ | Signal | Exponential Moving Averages (EMA) Period | Value $ | Signal | |
|---|---|---|---|---|---|---|
| 2 | 99.55 | BUY | 2 | 99.49 | BUY | |
| 3 | 99.11 | BUY | 3 | 99.06 | BUY | |
| 5 | 97.92 | BUY | 5 | 98.48 | BUY | |
| 8 | 96.97 | BUY | 8 | 98.36 | BUY | |
| 13 | 98.22 | BUY | 13 | 98.99 | BUY | |
| 21 | 101.45 | SELL | 21 | 100.11 | SELL | |
| 34 | 102.29 | SELL | 34 | 101.47 | SELL | |
| 55 | 103.37 | SELL | 55 | 103.28 | SELL | |
| 90 | 106.29 | SELL | 90 | 106.28 | SELL | |
| 200 | 118.37 | SELL | 200 | 114.05 | SELL |
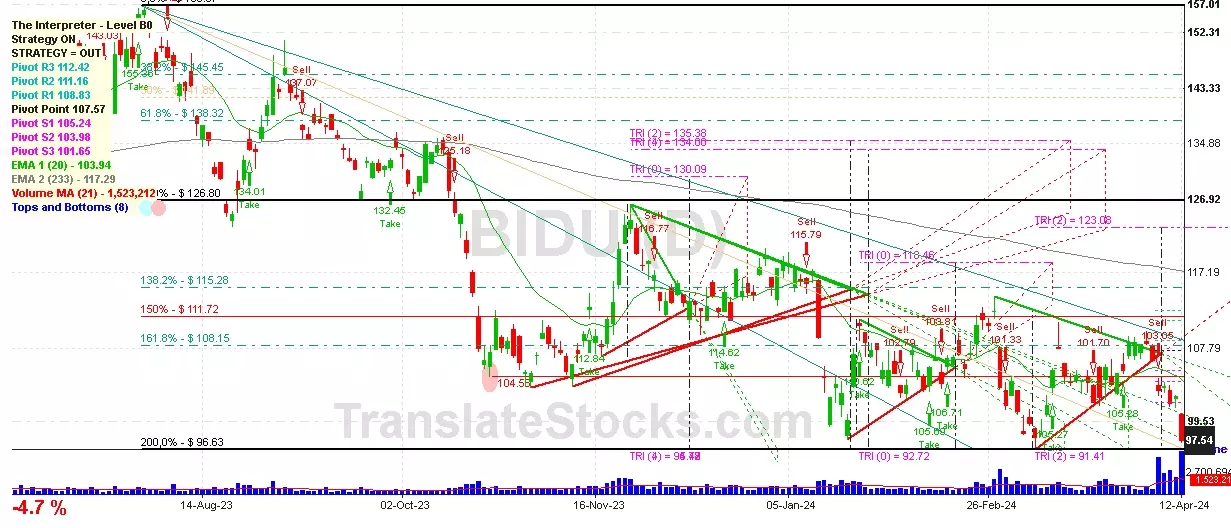
Baidu Inc - Spon Adr
IPO: 2005-08-05
Ticker: BIDUIndices: Nasdaq 100,
Exchange: Nasdaq Nms - Global Market (CN - USD)
Website: https://ir.baidu.com/
Phone:
ADR
Technology (
Services-computer Programming, Data Processing, Etc.

 Click to Enlarge