
| Date | Price $ | Result % | Candle Name | Side |
|---|---|---|---|---|
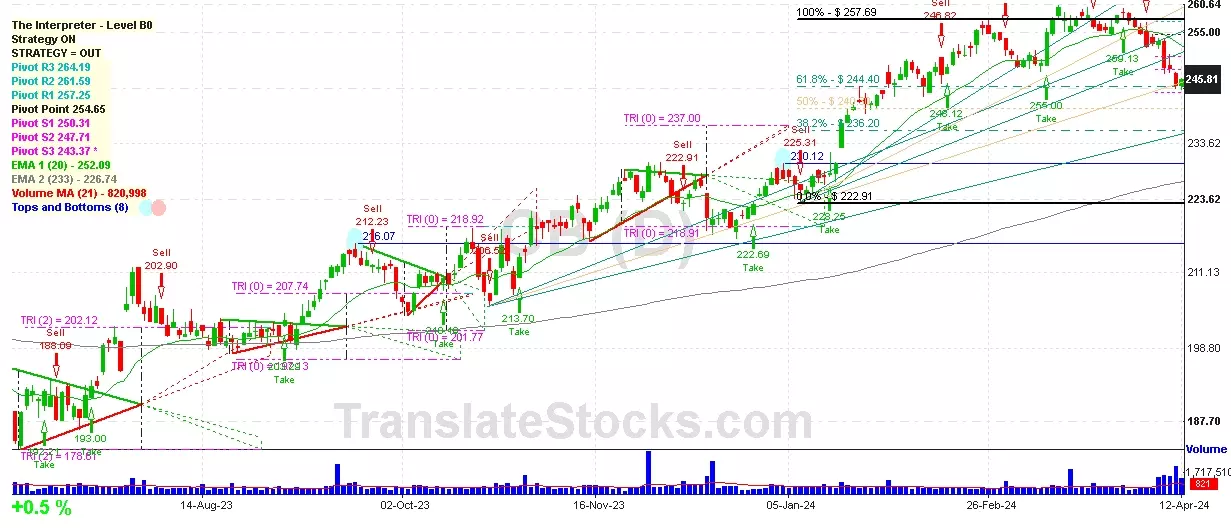
| 001 01 Apr 2024 | Sell Price: 257.40 | Profit: Close Day1 ($ 256.34) | Abandoned Baby | Sell |
| 002 14 Mar 2024 | Sell Price: 257.63 | Profit: Open Day1 ($ 255.33) | Abandoned Baby | Sell |
| 003 18 Dec 2023 | Buy Price: 220.31 | Profit: Close Day1 ($ 221.81) | Abandoned Baby | Buy |
| 004 26 Oct 2023 | Sell Price: 213.09 | Profit: Open Day1 ($ 211.36) | Engulfing | Sell |
| 005 24 Oct 2023 | Buy Price: 211.44 | Profit: Open Day1 ($ 214.99) | Abandoned Baby | Buy |
| 006 17 Aug 2023 | Sell Price: 200.04 | Profit: Open Day1 ($ 199.41) | Dark Cloud Cover | Sell |
| 007 10 Aug 2023 | Buy Price: 201.61 | Profit: Close Day1 ($ 201.77) | Abandoned Baby | Buy |
| 008 02 Aug 2023 | Buy Price: 205.55 | Loss: Close Day2 ($ 200.82) | Engulfing | Buy |
| 009 28 Jul 2023 | Sell Price: 205.98 | Profit: Open Day1 ($ 205.42) | Engulfing | Sell |
| 010 11 Jul 2023 | Buy Price: 192.11 | Profit: Open Day1 ($ 192.94) | Engulfing | Buy |
| 011One Year Average | Both Sides Result for 10 Signals |
Profit: $ 7.59 ($ 0.76 / Signal) |
All of Them | Buy + Sell |
| Simple Moving Averages (SMA) Period | Value $ | Signal | Exponential Moving Averages (EMA) Period | Value $ | Signal | |
|---|---|---|---|---|---|---|
| 2 | 244.48 | BUY | 2 | 245.73 | BUY | |
| 3 | 246.28 | SELL | 3 | 246.11 | SELL | |
| 5 | 248.11 | SELL | 5 | 246.57 | SELL | |
| 8 | 246.84 | SELL | 8 | 246.97 | SELL | |
| 13 | 246.58 | SELL | 13 | 247.79 | SELL | |
| 21 | 250.00 | SELL | 21 | 248.98 | SELL | |
| 34 | 252.46 | SELL | 34 | 249.59 | SELL | |
| 55 | 251.70 | SELL | 55 | 248.15 | SELL | |
| 90 | 243.86 | BUY | 90 | 243.55 | BUY | |
| 200 | 225.48 | BUY | 200 | 230.91 | BUY |
Chubb Ltd
IPO: 2008-07-18
Ticker: CBIndices: S&P 500,
Exchange: New York Stock Exchange, Inc. (CH - USD)
Website: https://www.chubb.com/
Phone:
Common Stock
Finance (
Fire, Marine & Casualty Insurance

 Click to Enlarge