| Date | Price $ | Result % | Candle Name | Side |
|---|---|---|---|---|
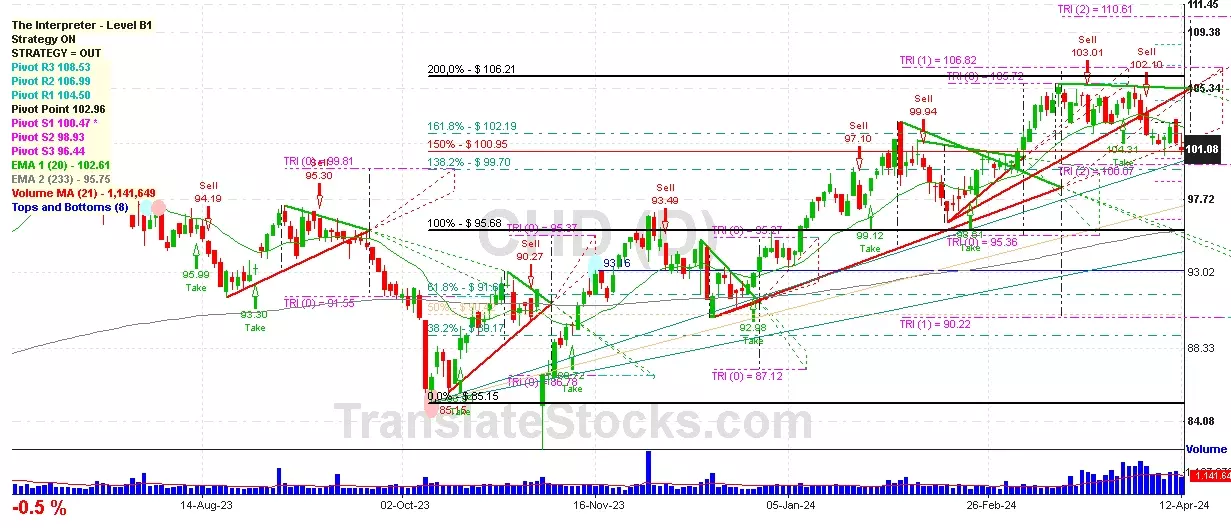
| 001 11 Apr 2024 | Sell Price: 101.58 | Profit: Open Day1 ($ 101.24) | Dark Cloud Cover | Sell |
| 002 25 Mar 2024 | Sell Price: 102.99 | Profit: Close Day1 ($ 102.84) | Engulfing | Sell |
| 003 20 Mar 2024 | Sell Price: 103.01 | Profit: Open Day1 ($ 102.79) | Abandoned Baby | Sell |
| 004 08 Feb 2024 | Sell Price: 99.94 | Profit: Open Day1 ($ 99.84) | Abandoned Baby | Sell |
| 005 18 Jan 2024 | Sell Price: 97.83 | Profit: Close Day1 ($ 96.93) | Abandoned Baby | Sell |
| 006 03 Jan 2024 | Sell Price: 93.95 | Profit: Close Day2 ($ 93.87) | Engulfing | Sell |
| 007 21 Sep 2023 | Sell Price: 95.02 | Profit: Open Day1 ($ 94.88) | Abandoned Baby | Sell |
| 008 20 Sep 2023 | Buy Price: 95.11 | Loss: Close Day2 ($ 94.72) | Abandoned Baby | Buy |
| 009 10 Aug 2023 | Sell Price: 95.51 | Profit: Close Day2 ($ 95.14) | Engulfing | Sell |
| 010 10 Aug 2023 | Sell Price: 95.55 | Profit: Close Day2 ($ 95.14) | Dark Cloud Cover | Sell |
| 011 03 Aug 2023 | Sell Price: 95.11 | Profit: Open Day1 ($ 94.93) | Engulfing | Sell |
| 012 31 Jul 2023 | Sell Price: 95.67 | Loss: Close Day2 ($ 96.82) | Engulfing | Sell |
| 013 20 Jun 2023 | Sell Price: 94.43 | Loss: Close Day2 ($ 97.55) | Engulfing | Sell |
| 014 26 May 2023 | Buy Price: 93.97 | Loss: Close Day2 ($ 92.45) | Engulfing | Buy |
| 015 19 May 2023 | Buy Price: 95.03 | Loss: Close Day2 ($ 93.93) | Abandoned Baby | Buy |
| 016One Year Average | Both Sides Result for 15 Signals |
Loss: $ -4.39 ($ -0.29 / Signal) |
All of Them | Buy + Sell |
| Simple Moving Averages (SMA) Period | Value $ | Signal | Exponential Moving Averages (EMA) Period | Value $ | Signal | |
|---|---|---|---|---|---|---|
| 2 | 107.31 | SELL | 2 | 107.17 | BUY | |
| 3 | 107.11 | BUY | 3 | 106.91 | BUY | |
| 5 | 106.32 | BUY | 5 | 106.29 | BUY | |
| 8 | 105.20 | BUY | 8 | 105.52 | BUY | |
| 13 | 103.87 | BUY | 13 | 104.76 | BUY | |
| 21 | 103.68 | BUY | 21 | 104.13 | BUY | |
| 34 | 103.83 | BUY | 34 | 103.40 | BUY | |
| 55 | 102.28 | BUY | 55 | 102.25 | BUY | |
| 90 | 99.94 | BUY | 90 | 100.56 | BUY | |
| 200 | 96.36 | BUY | 200 | 97.15 | BUY |
Church & Dwight Co Inc
IPO: 1990-08-15
Ticker: CHDIndices: S&P 500,
Exchange: New York Stock Exchange, Inc. (US - USD)
Website: https://churchdwight.com/
Phone:
Common Stock
Life Sciences (
Soap, Detergents, Cleang Preparations, Perfumes, Cosmetics

 Click to Enlarge