
| Date | Price $ | Result % | Candle Name | Side |
|---|---|---|---|---|
| 001 19 Apr 2024 | Sell Price: 157.95 | Loss: Close Day2 ($ 160.80) | Engulfing | Sell |
| 002 17 Apr 2024 | Buy Price: 158.09 | Profit: Open Day1 ($ 158.33) | Abandoned Baby | Buy |
| 003 22 Mar 2024 | Sell Price: 165.08 | Profit: Close Day1 ($ 164.29) | Engulfing | Sell |
| 004 29 Feb 2024 | Sell Price: 160.42 | Profit: Open Day1 ($ 159.65) | Engulfing | Sell |
| 005 22 Feb 2024 | Buy Price: 156.39 | Profit: Open Day1 ($ 157.72) | Abandoned Baby | Buy |
| 006 13 Feb 2024 | Buy Price: 164.13 | Profit: Close Day1 ($ 165.29) | Engulfing | Buy |
| 007 31 Jan 2024 | Sell Price: 158.93 | Loss: Close Day2 ($ 162.00) | Engulfing | Sell |
| 008 19 Jan 2024 | Sell Price: 157.73 | Profit: Close Day2 ($ 157.05) | Engulfing | Sell |
| 009 16 Jan 2024 | Sell Price: 156.10 | Profit: Open Day1 ($ 155.57) | Engulfing | Sell |
| 010 20 Dec 2023 | Sell Price: 149.61 | Loss: Close Day2 ($ 152.25) | Engulfing | Sell |
| 011 30 Nov 2023 | Sell Price: 146.00 | Profit: Open Day1 ($ 145.75) | Abandoned Baby | Sell |
| 012 31 Oct 2023 | Buy Price: 134.25 | Profit: Open Day1 ($ 134.98) | Engulfing | Buy |
| 013 19 Oct 2023 | Sell Price: 135.50 | Profit: Open Day1 ($ 135.36) | Engulfing | Sell |
| 014 11 Oct 2023 | Sell Price: 134.37 | Profit: Open Day1 ($ 134.09) | Engulfing | Sell |
| 015 04 Oct 2023 | Buy Price: 133.34 | Profit: Open Day1 ($ 133.37) | Engulfing | Buy |
| 016 29 Sep 2023 | Sell Price: 133.28 | Profit: Open Day1 ($ 133.20) | Dark Cloud Cover | Sell |
| 017 21 Sep 2023 | Sell Price: 135.87 | Loss: Close Day2 ($ 136.37) | Abandoned Baby | Sell |
| 018 18 Sep 2023 | Sell Price: 135.58 | Loss: Close Day2 ($ 137.46) | Abandoned Baby | Sell |
| 019 05 Sep 2023 | Buy Price: 133.85 | Profit: Open Day1 ($ 133.90) | Piercing Line | Buy |
| 020 01 Sep 2023 | Sell Price: 133.14 | Profit: Open Day1 ($ 132.55) | Engulfing | Sell |
| 021 24 Aug 2023 | Sell Price: 131.94 | Loss: Close Day2 ($ 133.73) | Engulfing | Sell |
| 022 04 Aug 2023 | Sell Price: 127.18 | Profit: Close Day1 ($ 126.75) | Engulfing | Sell |
| 023 03 Aug 2023 | Buy Price: 131.96 | Profit: Open Day1 ($ 132.16) | Engulfing | Buy |
| 024 25 Jul 2023 | Buy Price: 128.71 | Profit: Open Day1 ($ 131.20) | Engulfing | Buy |
| 025 19 Jul 2023 | Sell Price: 127.32 | Loss: Close Day2 ($ 128.50) | Engulfing | Sell |
| 026 14 Jul 2023 | Sell Price: 125.52 | Profit: Open Day1 ($ 124.97) | Engulfing | Sell |
| 027 11 Jul 2023 | Buy Price: 127.81 | Profit: Open Day1 ($ 128.48) | Engulfing | Buy |
| 028 30 Jun 2023 | Sell Price: 125.62 | Profit: Open Day1 ($ 125.51) | Engulfing | Sell |
| 029 20 Jun 2023 | Sell Price: 128.47 | Profit: Open Day1 ($ 128.26) | Abandoned Baby | Sell |
| 030 31 May 2023 | Buy Price: 124.81 | Loss: Close Day2 ($ 124.03) | Engulfing | Buy |
| 031 30 May 2023 | Sell Price: 123.44 | Profit: Open Day1 ($ 122.19) | Dark Cloud Cover | Sell |
| 032 25 May 2023 | Sell Price: 123.04 | Loss: Close Day2 ($ 123.44) | Dark Cloud Cover | Sell |
| 033 02 May 2023 | Buy Price: 120.75 | Loss: Close Day2 ($ 118.46) | Piercing Line | Buy |
| 034One Year Average | Both Sides Result for 33 Signals |
Loss: $ -3.82 ($ -0.12 / Signal) |
All of Them | Buy + Sell |
| Simple Moving Averages (SMA) Period | Value $ | Signal | Exponential Moving Averages (EMA) Period | Value $ | Signal | |
|---|---|---|---|---|---|---|
| 2 | 156.98 | SELL | 2 | 155.53 | SELL | |
| 3 | 158.25 | SELL | 3 | 156.63 | SELL | |
| 5 | 158.30 | SELL | 5 | 157.60 | SELL | |
| 8 | 158.10 | SELL | 8 | 158.39 | SELL | |
| 13 | 159.67 | SELL | 13 | 159.36 | SELL | |
| 21 | 161.31 | SELL | 21 | 160.33 | SELL | |
| 34 | 162.54 | SELL | 34 | 160.86 | SELL | |
| 55 | 161.88 | SELL | 55 | 160.24 | SELL | |
| 90 | 159.42 | SELL | 90 | 157.62 | SELL | |
| 200 | 146.29 | BUY | 200 | 149.24 | BUY |
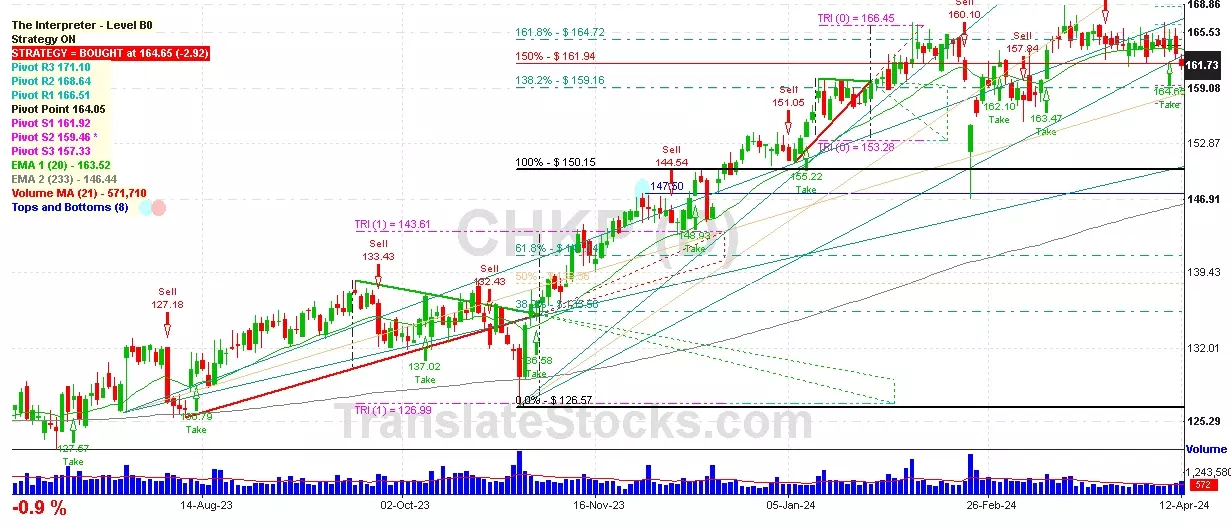
Check Point Software Tech
IPO: 1996-06-28
Ticker: CHKPIndices: Nasdaq 100,
Exchange: Nasdaq Nms - Global Market (IL - USD)
Website: https://www.checkpoint.com
Phone:
Common Stock
Technology (
Services-prepackaged Software

 Click to Enlarge