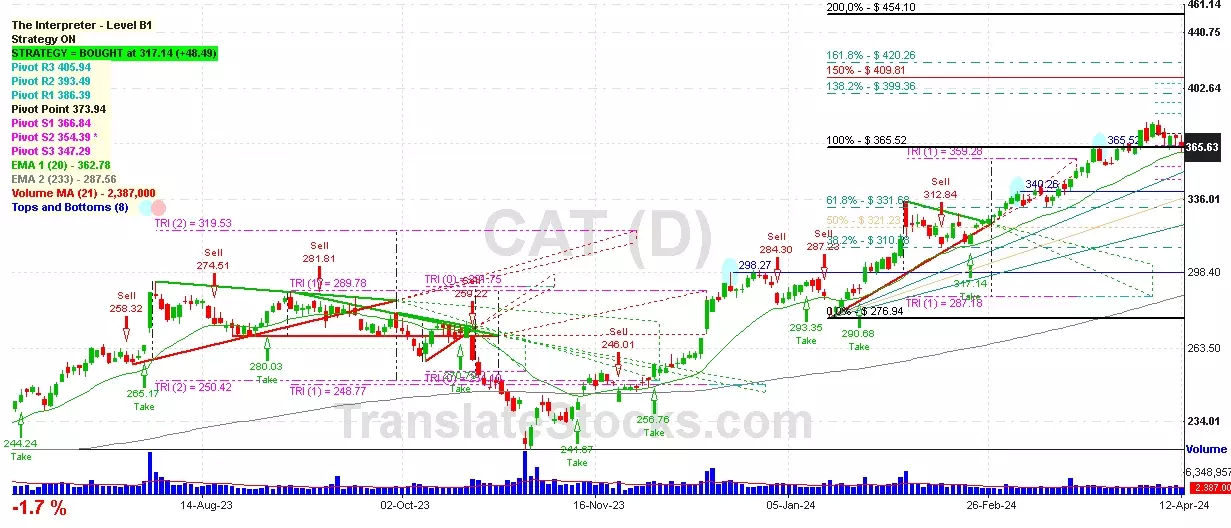
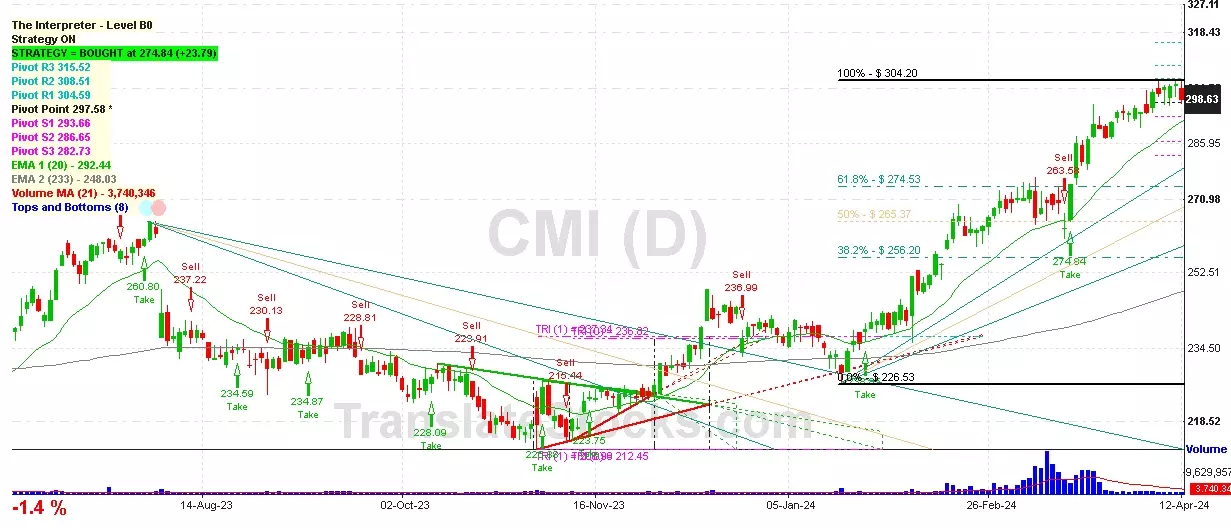
Hey Friend, I'm analysing CUMMINS INC (CMI), and it is between the Support of $ 297.58 (Pivot) and the Resistance of $ 304.20 (100% of Fibonacci). The stock is also approaching the line of Pivot at $ 297.58, and if it goes below this line it could reach the next Support of 61.8% of Fibonacci at $ 274.53.

| Date | Price $ | Result % | Candle Name | Side |
|---|---|---|---|---|
| 001 12 Apr 2024 | Sell Price: 298.63 | Profit: Close Day1 ($ 295.78) | Abandoned Baby | Sell |
| 002 29 Feb 2024 | Sell Price: 268.61 | Loss: Close Day2 ($ 271.27) | Engulfing | Sell |
| 003 02 Jan 2024 | Buy Price: 241.18 | Loss: Close Day2 ($ 235.82) | Engulfing | Buy |
| 004 22 Nov 2023 | Buy Price: 224.51 | Profit: Close Day1 ($ 225.49) | Engulfing | Buy |
| 005 20 Nov 2023 | Sell Price: 224.16 | Profit: Open Day1 ($ 224.01) | Abandoned Baby | Sell |
| 006 20 Nov 2023 | Sell Price: 224.19 | Profit: Open Day1 ($ 224.01) | Engulfing | Sell |
| 007 16 Nov 2023 | Sell Price: 223.42 | Loss: Close Day2 ($ 224.16) | Abandoned Baby | Sell |
| 008 06 Nov 2023 | Sell Price: 220.00 | Profit: Open Day1 ($ 218.90) | Engulfing | Sell |
| 009 17 Aug 2023 | Buy Price: 232.90 | Profit: Close Day1 ($ 233.62) | Abandoned Baby | Buy |
| 010 11 Aug 2023 | Buy Price: 238.72 | Loss: Close Day2 ($ 232.54) | Engulfing | Buy |
| 011 23 Jun 2023 | Buy Price: 232.40 | Profit: Open Day1 ($ 232.95) | Engulfing | Buy |
| 012 23 Jun 2023 | Buy Price: 232.02 | Profit: Open Day1 ($ 232.95) | Piercing Line | Buy |
| 013 30 May 2023 | Sell Price: 209.06 | Profit: Open Day1 ($ 207.77) | Engulfing | Sell |
| 014 05 May 2023 | Buy Price: 226.38 | Profit: Open Day1 ($ 228.07) | Abandoned Baby | Buy |
| 015One Year Average | Both Sides Result for 14 Signals |
Loss: $ -4.51 ($ -0.32 / Signal) |
All of Them | Buy + Sell |
| Simple Moving Averages (SMA) Period | Value $ | Signal | Exponential Moving Averages (EMA) Period | Value $ | Signal | |
|---|---|---|---|---|---|---|
| 2 | 291.87 | SELL | 2 | 291.65 | SELL | |
| 3 | 292.14 | SELL | 3 | 291.64 | SELL | |
| 5 | 290.88 | BUY | 5 | 291.75 | SELL | |
| 8 | 291.47 | SELL | 8 | 292.32 | SELL | |
| 13 | 294.87 | SELL | 13 | 292.81 | SELL | |
| 21 | 295.41 | SELL | 21 | 291.72 | SELL | |
| 34 | 289.30 | BUY | 34 | 287.51 | BUY | |
| 55 | 279.42 | BUY | 55 | 279.77 | BUY | |
| 90 | 263.82 | BUY | 90 | 269.51 | BUY | |
| 200 | 246.90 | BUY | 200 | 253.76 | BUY |
Cummins Inc
IPO: 1964-09-10
Ticker: CMIIndices: S&P 500,
Exchange: New York Stock Exchange, Inc. (US - USD)
Website: http://www.cummins.com
Phone:
Common Stock
Technology (
Engines & Turbines
 Click to Enlarge