| Date | Price $ | Result % | Candle Name | Side |
|---|---|---|---|---|
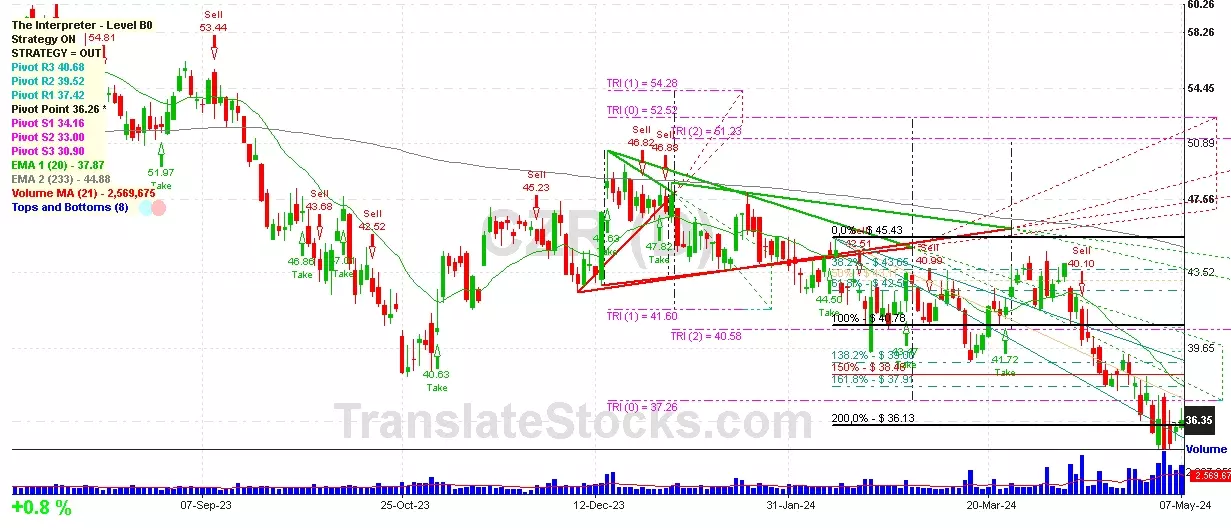
| 001 10 Apr 2024 | Sell Price: 41.50 | Profit: Close Day2 ($ 40.10) | Abandoned Baby | Sell |
| 002 01 Apr 2024 | Sell Price: 43.17 | Profit: Open Day1 ($ 42.56) | Engulfing | Sell |
| 003 22 Jan 2024 | Sell Price: 45.81 | Profit: Close Day1 ($ 45.75) | Engulfing | Sell |
| 004 02 Jan 2024 | Buy Price: 47.78 | Loss: Close Day2 ($ 44.91) | Engulfing | Buy |
| 005 08 Dec 2023 | Buy Price: 44.19 | Loss: Close Day2 ($ 43.44) | Engulfing | Buy |
| 006 11 Sep 2023 | Sell Price: 53.30 | Profit: Close Day2 ($ 52.35) | Engulfing | Sell |
| 007 11 Sep 2023 | Sell Price: 53.44 | Profit: Close Day2 ($ 52.35) | Dark Cloud Cover | Sell |
| 008 05 Sep 2023 | Sell Price: 54.07 | Profit: Open Day1 ($ 53.63) | Abandoned Baby | Sell |
| 009 18 Jul 2023 | Buy Price: 56.35 | Profit: Open Day1 ($ 56.80) | Abandoned Baby | Buy |
| 010 26 Jun 2023 | Buy Price: 46.78 | Profit: Open Day1 ($ 46.79) | Engulfing | Buy |
| 011One Year Average | Both Sides Result for 10 Signals |
Profit: $ 1.39 ($ 0.14 / Signal) |
All of Them | Buy + Sell |
| Simple Moving Averages (SMA) Period | Value $ | Signal | Exponential Moving Averages (EMA) Period | Value $ | Signal | |
|---|---|---|---|---|---|---|
| 2 | 35.69 | BUY | 2 | 35.83 | BUY | |
| 3 | 35.51 | BUY | 3 | 35.82 | BUY | |
| 5 | 35.74 | BUY | 5 | 36.00 | BUY | |
| 8 | 36.37 | SELL | 8 | 36.43 | SELL | |
| 13 | 37.16 | SELL | 13 | 37.17 | SELL | |
| 21 | 38.68 | SELL | 21 | 38.14 | SELL | |
| 34 | 40.07 | SELL | 34 | 39.20 | SELL | |
| 55 | 40.64 | SELL | 55 | 40.34 | SELL | |
| 90 | 42.29 | SELL | 90 | 41.63 | SELL | |
| 200 | 45.64 | SELL | 200 | 44.13 | SELL |
Caesars Entertainment Inc
IPO: 2014-09-19
Ticker: CZRIndices: S&P 500,
Exchange: Nasdaq Nms - Global Market (US - USD)
Website: https://www.caesars.com/
Phone:
Common Stock
Real Estate & Construction (
Hotels & Motels

 Click to Enlarge