
| Date | Price $ | Result % | Candle Name | Side |
|---|---|---|---|---|
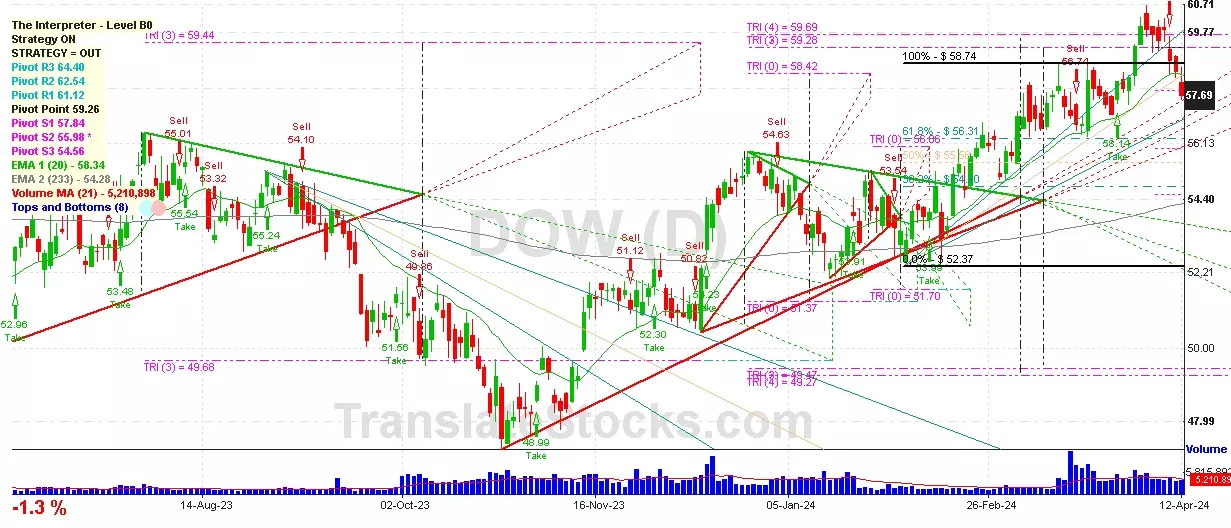
| 001 14 Mar 2024 | Sell Price: 57.32 | Profit: Close Day1 ($ 57.04) | Abandoned Baby | Sell |
| 002 02 Jan 2024 | Buy Price: 55.33 | Loss: Close Day2 ($ 54.19) | Engulfing | Buy |
| 003 05 Oct 2023 | Sell Price: 49.86 | Profit: Open Day1 ($ 49.77) | Abandoned Baby | Sell |
| 004 03 Aug 2023 | Buy Price: 54.90 | Profit: Open Day1 ($ 54.96) | Piercing Line | Buy |
| 005 14 Jun 2023 | Sell Price: 52.81 | Profit: Open Day1 ($ 52.74) | Dark Cloud Cover | Sell |
| 006One Year Average | Both Sides Result for 5 Signals |
Loss: $ -0.64 ($ -0.13 / Signal) |
All of Them | Buy + Sell |
| Simple Moving Averages (SMA) Period | Value $ | Signal | Exponential Moving Averages (EMA) Period | Value $ | Signal | |
|---|---|---|---|---|---|---|
| 2 | 56.71 | SELL | 2 | 56.60 | SELL | |
| 3 | 56.72 | SELL | 3 | 56.66 | SELL | |
| 5 | 56.76 | SELL | 5 | 56.76 | SELL | |
| 8 | 56.75 | SELL | 8 | 56.95 | SELL | |
| 13 | 57.40 | SELL | 13 | 57.24 | SELL | |
| 21 | 58.04 | SELL | 21 | 57.42 | SELL | |
| 34 | 57.78 | SELL | 34 | 57.31 | SELL | |
| 55 | 56.88 | SELL | 55 | 56.78 | SELL | |
| 90 | 55.81 | BUY | 90 | 55.92 | BUY | |
| 200 | 53.78 | BUY | 200 | 54.62 | BUY |
Common Stock
Life Sciences (
Plastic Materials, Synth Resins & Nonvulcan Elastomers

 Click to Enlarge