
| Date | Price $ | Result % | Candle Name | Side |
|---|---|---|---|---|
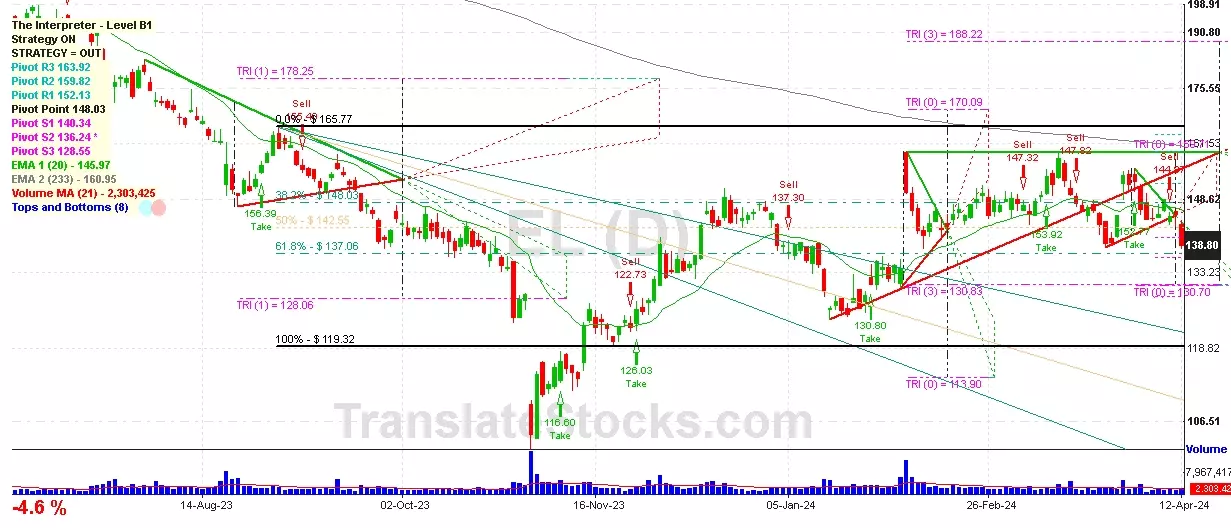
| 001 17 Apr 2024 | Buy Price: 138.04 | Profit: Open Day1 ($ 139.33) | Abandoned Baby | Buy |
| 002 01 Apr 2024 | Sell Price: 152.03 | Profit: Open Day2 ($ 151.26) | Engulfing | Sell |
| 003 20 Mar 2024 | Buy Price: 146.76 | Profit: Open Day1 ($ 147.50) | Piercing Line | Buy |
| 004 20 Feb 2024 | Sell Price: 145.11 | Profit: Open Day1 ($ 144.76) | Abandoned Baby | Sell |
| 005 12 Jan 2024 | Sell Price: 134.81 | Profit: Open Day1 ($ 133.74) | Engulfing | Sell |
| 006 14 Nov 2023 | Buy Price: 122.82 | Profit: Open Day1 ($ 124.00) | Abandoned Baby | Buy |
| 007 09 Nov 2023 | Sell Price: 115.32 | Profit: Close Day1 ($ 114.75) | Dark Cloud Cover | Sell |
| 008 02 Nov 2023 | Buy Price: 114.38 | Profit: Open Day1 ($ 116.41) | Engulfing | Buy |
| 009 20 Jun 2023 | Sell Price: 197.55 | Profit: Open Day1 ($ 196.30) | Abandoned Baby | Sell |
| 010 15 May 2023 | Buy Price: 201.19 | Profit: Open Day1 ($ 201.50) | Abandoned Baby | Buy |
| 011One Year Average | Both Sides Result for 10 Signals |
Profit: $ 9.56 ($ 0.96 / Signal) |
All of Them | Buy + Sell |
| Simple Moving Averages (SMA) Period | Value $ | Signal | Exponential Moving Averages (EMA) Period | Value $ | Signal | |
|---|---|---|---|---|---|---|
| 2 | 146.22 | BUY | 2 | 146.92 | BUY | |
| 3 | 146.60 | BUY | 3 | 146.77 | BUY | |
| 5 | 147.24 | BUY | 5 | 146.35 | BUY | |
| 8 | 145.43 | BUY | 8 | 145.70 | BUY | |
| 13 | 143.59 | BUY | 13 | 145.23 | BUY | |
| 21 | 145.47 | BUY | 21 | 145.20 | BUY | |
| 34 | 146.33 | BUY | 34 | 145.17 | BUY | |
| 55 | 146.35 | BUY | 55 | 144.54 | BUY | |
| 90 | 142.94 | BUY | 90 | 144.25 | BUY | |
| 200 | 145.31 | BUY | 200 | 154.64 | SELL |
Estee Lauder Companies-cl A
IPO: 1995-11-17
Ticker: ELIndices: S&P 500,
Exchange: New York Stock Exchange, Inc. (US - USD)
Website: https://www.elcompanies.com/
Phone:
Common Stock
Life Sciences (
Perfumes, Cosmetics & Other Toilet Preparations
Year | 2021 | 2020 | 2019 | 2018 | 2017 | 2016 | 2015 | 2014 | 2013 | 2012 | 2011 | 2010 | 2009 | 2008 | |
|---|---|---|---|---|---|---|---|---|---|---|---|---|---|---|---|
| 1 | Assets + | 21,971 | 17,781 | 13,156 | 12,567 | 11,568 | 9,223 | 8,239 | 7,869 | 7,145 | 6,593 | 6,274 | 5,336 | 5,177 | 402 |
| 2 | Cash and Cash Equivalents + | 0 | 0 | 0 | 2,181 | 1,136 | 914 | 1,021 | 1,629 | 1,496 | 1,348 | 1,253 | 1,121 | 864 | 402 |
| 3 | Property + | 2,280 | 2,055 | 2,068 | 1,823 | 1,671 | 1,583 | 1,490 | 1,503 | 1,351 | 1,232 | 1,143 | 1,024 | 1,027 | 0 |
| 4 | Property + | 5,618 | 5,134 | 4,831 | 4,435 | 4,019 | 3,796 | 3,580 | 3,530 | 3,228 | 2,968 | 2,862 | 2,525 | 0 | 0 |
| 5 | Intangible Assets + | 4,095 | 2,338 | 1,203 | 1,276 | 1,327 | 344 | 327 | 157 | 170 | 190 | 228 | 110 | 0 | 0 |
| 6 | Finite-Lived Intangible Assets + | 1,729 | 1,115 | 315 | 365 | 417 | 55 | 66 | 52 | 64 | 76 | 102 | 54 | 0 | 0 |
| 7 | Liabilities and Equity + | 21,971 | 17,781 | 13,156 | 12,567 | 11,568 | 9,223 | 8,239 | 7,869 | 7,145 | 6,593 | 6,274 | 5,336 | 1,664 | 102 |
| 8 | Liabilities + | 15,023 | 13,819 | 8,745 | 7,857 | 7,166 | 5,636 | 4,585 | 4,000 | 3,844 | 3,846 | 3,627 | 3,370 | 0 | 0 |
| 9 | Temporary Equity + | 857 | 0 | 0 | 0 | 0 | 0 | 0 | 0 | 0 | 0 | 0 | 0 | 0 | 0 |
| 10 | Redeemable Noncontrolling Interest + | 857 | 0 | 0 | 0 | 0 | 0 | 0 | 0 | 0 | 0 | 0 | 0 | 0 | 0 |
| 11 | Stockholders' Equity + | 6,091 | 3,962 | 4,411 | 4,710 | 4,402 | 3,587 | 3,654 | 3,869 | 3,302 | 2,748 | 2,647 | 1,965 | 1,664 | 0 |
| 12 | Stockholders' Equity Attributable to Parent + | 6,057 | 3,935 | 4,386 | 4,688 | 4,384 | 3,572 | 3,643 | 3,855 | 3,287 | 2,733 | 2,629 | 1,948 | 0 | 0 |
| 13 | Stockholders' Equity + | 0.01 | 0.01 | 0.01 | 0 | 0 | 0 | 0 | 0 | 0 | 0 | 0 | 0 | 0 | 0 |
| 14 | Common Stock + | 0.01 | 0.01 | 0.01 | 0 | 0 | 0 | 0 | 0 | 0 | 0 | 0 | 0 | 0 | 0 |
| 15 | Partners' Capital + | 12,244 | 10,134 | 9,984 | 9,040 | 8,452 | 7,693 | 7,004 | 6,266 | 5,364 | 4,765 | 4,116 | 3,564 | -117 | 102 |
| 16 | Partners' Capital + | 12,244 | 10,134 | 9,984 | 9,040 | 8,452 | 7,693 | 7,004 | 6,266 | 5,364 | 4,765 | 4,116 | 3,564 | -117 | 102 |
| 17 | Limited Liability Company (LLC) Members' Equity + | 11,774 | 9,469 | 9,421 | 8,606 | 7,968 | 7,148 | 6,622 | 6,166 | 5,206 | 4,552 | 4,134 | 3,367 | -117 | 0 |
| 18 | Limited Liability Company (LLC) Members' Equity + | 11,774 | 9,469 | 9,421 | 8,606 | 7,968 | 7,148 | 6,622 | 6,166 | 5,206 | 4,552 | 4,134 | 3,367 | -117 | 0 |
| 19 | Current Assets + | 9,768 | 8,892 | 7,212 | 6,168 | 4,964 | 4,225 | 4,468 | 4,825 | 4,297 | 3,855 | 3,686 | 3,121 | 0 | 0 |
| 20 | Cash + | 0 | 0 | 0 | 534 | 605 | 469 | 504 | 0 | 0 | 0 | 0 | 0 | 0 | 0 |
| 21 | Current Other Undisclosed Receivables | 5,561 | 5,636 | 3,375 | 0 | 0 | 0 | 0 | 2,152 | 2,011 | 1,811 | 1,744 | 1,548 | 0 | 0 |
| 22 | Current Receivables + | 7,263 | 6,830 | 5,206 | 1,487 | 1,395 | 1,258 | 1,174 | 3,531 | 3,183 | 2,871 | 2,690 | 2,294 | 0 | 0 |
| 23 | Inventory + | 2,505 | 2,062 | 2,006 | 1,618 | 1,479 | 1,263 | 1,216 | 1,294 | 1,114 | 984 | 996 | 827 | 0 | 0 |
| 24 | Long-Term Assets + | 5,828 | 4,496 | 2,673 | 2,457 | 2,580 | 1,963 | 1,534 | 1,383 | 1,328 | 1,316 | 1,217 | 1,081 | 760 | 0 |
| 25 | Long-term Investments and Receivables + | 0 | 0 | 177 | 843 | 1,026 | 1,108 | 420 | 14 | 0 | 0 | 0 | 0 | 0 | 0 |
| 26 | Current Liabilities + | 5,298 | 5,179 | 4,605 | 3,310 | 2,823 | 2,680 | 2,136 | 2,057 | 1,935 | 2,126 | 1,943 | 1,572 | 0 | 0 |
| 27 | Long-Term Liabilities + | 9,725 | 8,640 | 4,140 | 4,547 | 4,343 | 2,956 | 2,449 | 1,943 | 1,909 | 1,720 | 1,684 | 1,798 | 0 | 0 |
| 28 | Increase (Decrease) in Stockholders' Equity [Roll Forward] + | -11,058 | -10,330 | -9,444 | -7,896 | -7,149 | -6,743 | -5,857 | -4,879 | -4,215 | -3,830 | -3,243 | -2,850 | 0 | 0 |
| 29 | Treasury Stock Transactions + | -11,058 | -10,330 | -9,444 | -7,896 | -7,149 | -6,743 | -5,857 | -4,879 | -4,215 | -3,830 | -3,243 | -2,850 | 0 | 0 |
| 30 | Treasury Stock + | -11,058 | -10,330 | -9,444 | -7,896 | -7,149 | -6,743 | -5,857 | -4,879 | -4,215 | -3,830 | -3,243 | -2,850 | 0 | 0 |
| 31 | Total Current Assets + | 9,768 | 8,892 | 7,212 | 6,168 | 4,964 | 4,225 | 4,468 | 4,825 | 4,297 | 3,855 | 3,686 | 3,121 | 0 | 0 |
| 32 | Operating Lease + | 2,190 | 2,282 | 0 | 0 | 0 | 0 | 0 | 0 | 0 | 0 | 0 | 0 | 0 | 0 |
| 33 | Goodwill + | 2,616 | 1,401 | 1,868 | 1,926 | 1,916 | 1,228 | 1,145 | 893 | 882 | 883 | 877 | 752 | 760 | 0 |
| 34 | Long-Term Other Assets + | 1,022 | 813 | 805 | 531 | 664 | 735 | 389 | 490 | 446 | 433 | 340 | 329 | 0 | 0 |
| 35 | Total Assets + | 21,971 | 17,781 | 13,156 | 12,567 | 11,568 | 9,223 | 8,239 | 7,869 | 7,145 | 6,593 | 6,274 | 5,336 | 5,177 | 0 |
| 36 | Total Liabilities + | 0 | 0 | 8,745 | 0 | 0 | 0 | 0 | 0 | 0 | 0 | 0 | 0 | 0 | 0 |
| 37 | Stockholders' Equity Attributable to Noncontrolling Interest + | 34 | 27 | 25 | 22 | 18 | 15 | 11 | 14 | 15 | 14 | 18 | 17 | 0 | 0 |
| 38 | Total Stockholders' Equity + | 6,091 | 3,962 | 4,411 | 4,710 | 4,402 | 3,587 | 3,654 | 3,869 | 3,302 | 2,748 | 2,647 | 1,965 | 1,664 | 0 |
| 39 | Total Liabilities and Equity + | 21,971 | 17,781 | 13,156 | 12,567 | 11,568 | 9,223 | 8,239 | 7,869 | 7,145 | 6,593 | 6,274 | 5,336 | 0 | 0 |
Year | 2021 | 2020 | 2019 | 2018 | 2017 | 2016 | 2015 | 2014 | 2013 | 2012 | 2011 | 2010 | 2009 | |
|---|---|---|---|---|---|---|---|---|---|---|---|---|---|---|
| 1 | -3,834 | -3,552 | -3,387 | -2,844 | -2,437 | -2,181 | -2,101 | -2,158 | -2,026 | -1,996 | -1,937 | -1,829 | -1,882 | |
| 2 | 12,381 | 10,742 | 11,476 | 10,839 | 9,387 | 9,081 | 8,680 | 8,811 | 8,156 | 7,718 | 6,873 | 5,966 | 5,442 | |
| 3 | 0 | 0 | 0 | 0 | 0 | 0 | 0 | 158 | 104 | 96 | 86 | 80 | 82 | |
| 4 | 516 | 514 | 495 | 469 | 428 | 401 | 400 | 378 | 330 | 287 | 284 | 0 | 0 | |
| 5 | 0 | 0 | 0 | 0 | 0 | 0 | 0 | 0 | 0 | -10 | 0 | 0 | 0 | |
| 6 | 0 | 0 | 0 | 1,491 | 1,405 | 1,387 | 1,378 | 1,410 | 1,412 | 1,343 | 1,152 | 1,070 | 1,074 | |
| 7 | 0 | 0 | 3,440 | 3,508 | 2,908 | 2,821 | 2,772 | 2,840 | 2,798 | 2,656 | 2,346 | 2,016 | 1,879 | |
| 8 | 9,371 | 8,637 | 8,857 | 8,553 | 7,469 | 7,338 | 7,074 | 6,986 | 6,597 | 6,325 | 5,697 | 5,067 | 4,884 | |
| 9 | -8 | 0 | 0 | 0 | 0 | 0 | 0 | 0 | 0 | 0 | 0 | 0 | 0 | |
| 10 | -23 | -20 | -17 | -15 | -5 | -17 | -14 | -13 | -15 | -13 | -8 | -23 | -11 | |
| 11 | 847 | 534 | 0 | 0 | 0 | 0 | 0 | 0 | 0 | 0 | 0 | 0 | 0 | |
| 12 | 0 | 0 | 71 | 0 | 0 | 0 | 0 | 0 | 0 | 0 | 0 | 0 | 0 | |
| 13 | -9,763 | -10,136 | -9,163 | -8,784 | -7,695 | -7,471 | -7,074 | -6,983 | -6,630 | -6,406 | -5,784 | -5,176 | -5,024 | |
| 14 | 2,618 | 606 | 2,313 | 2,055 | 1,692 | 1,610 | 1,606 | 1,828 | 1,526 | 1,312 | 1,089 | 790 | 418 | |
| 15 | 51 | 48 | 58 | 56 | 28 | 16 | 14 | 9 | 8 | 0 | 0 | 0 | 0 | |
| 16 | -12 | 51 | 46 | -95 | 15 | 16 | 4 | -47 | -4 | 0 | -19 | -33 | -20 | |
| 17 | 0 | 0 | 0 | 0 | 0 | 0 | 0 | 0 | 23 | 10 | 0 | 0 | 0 | |
| 18 | 0 | 1 | 0 | 0 | 0 | 0 | 0 | 0 | 0 | 0 | 0 | 0 | 0 | |
| 19 | 173 | 161 | 133 | 128 | 103 | 71 | 60 | 59 | 63 | 0 | 0 | 0 | 0 | |
| 20 | 0 | 0 | 0 | 0 | 0 | 0 | 0 | 0 | -19 | 0 | 0 | -27 | 0 | |
| 21 | 0 | 0 | 0 | 0 | 0 | 0 | 0 | 0 | 1,475 | 1,261 | 1,026 | 688 | 343 | |
| 22 | 3,331 | 1,046 | 2,307 | 1,980 | 1,617 | 1,555 | 1,561 | 1,777 | 1,475 | 1,261 | 0 | 0 | 0 | |
| 23 | -456 | -350 | -513 | -863 | -361 | -434 | -467 | -568 | -451 | -401 | -322 | -206 | -116 | |
| 24 | 2,875 | 696 | 1,794 | 1,117 | 1,256 | 1,121 | 1,093 | 1,209 | 1,024 | 860 | 704 | 482 | 227 | |
| 25 | 12 | 12 | 9 | 0 | 0 | 0 | 0 | 0 | 0 | 0 | 0 | 0 | 0 | |
| 26 | -7 | 0 | 0 | 0 | 0 | 0 | 0 | 0 | 0 | 0 | 0 | 0 | 0 | |
| 27 | -12 | -12 | -9 | -9 | -7 | -6 | -4 | -5 | -4 | -4 | -3 | -4 | -8 | |
| 28 | Total Net Income (Loss) Attributable to Parent + | 0 | 684 | 1,785 | 1,108 | 1,249 | 1,115 | 1,089 | 1,204 | 1,020 | 857 | 701 | 478 | 218 |
| 29 | 2,870 | 684 | 1,785 | 1,108 | 1,249 | 1,115 | 1,089 | 1,204 | 1,020 | 857 | 701 | 478 | 0 | |
| 30 | Total Earnings Per Share + | 7.91 | 1.90 | 4.91 | 3.01 | 3.40 | 3.01 | 2.87 | 3.12 | 2.63 | 2.20 | 3.56 | 2.42 | 1.11 |
| 31 | Total Earnings Per Share + | 7.79 | 1.86 | 4.82 | 2.95 | 3.35 | 2.96 | 2.82 | 3.06 | 2.58 | 2.16 | 3.48 | 2.38 | 1.10 |
| 32 | 2.07 | 1.39 | 1.67 | 1.48 | 1.32 | 1.14 | 0.92 | 0.78 | 1.08 | 0.52 | 0.75 | 0.55 | 0.55 |

 Click to Enlarge