| Date | Price $ | Result % | Candle Name | Side |
|---|---|---|---|---|
| 001 02 Apr 2024 | Sell Price: 189.53 | Profit: Open Day1 ($ 188.85) | Abandoned Baby | Sell |
| 002 22 Feb 2024 | Buy Price: 184.99 | Profit: Open Day1 ($ 185.55) | Abandoned Baby | Buy |
| 003 12 Jan 2024 | Sell Price: 176.15 | Profit: Open Day1 ($ 175.44) | Dark Cloud Cover | Sell |
| 004 20 Sep 2023 | Sell Price: 161.08 | Profit: Open Day1 ($ 159.36) | Engulfing | Sell |
| 005 20 Sep 2023 | Sell Price: 160.72 | Profit: Open Day1 ($ 159.36) | Dark Cloud Cover | Sell |
| 006 15 Sep 2023 | Sell Price: 158.47 | Loss: Close Day2 ($ 161.27) | Abandoned Baby | Sell |
| 007 22 Aug 2023 | Sell Price: 156.09 | Profit: Close Day2 ($ 155.80) | Engulfing | Sell |
| 008 03 Aug 2023 | Buy Price: 161.31 | Profit: Open Day1 ($ 161.95) | Engulfing | Buy |
| 009 20 Jul 2023 | Sell Price: 149.09 | Profit: Close Day1 ($ 148.82) | Abandoned Baby | Sell |
| 010 12 Jul 2023 | Sell Price: 148.32 | Profit: Close Day2 ($ 146.86) | Engulfing | Sell |
| 011 12 Jul 2023 | Sell Price: 148.37 | Profit: Close Day2 ($ 146.86) | Dark Cloud Cover | Sell |
| 012 20 Jun 2023 | Sell Price: 149.14 | Profit: Open Day1 ($ 148.00) | Abandoned Baby | Sell |
| 013 11 May 2023 | Sell Price: 134.80 | Loss: Close Day2 ($ 139.94) | Abandoned Baby | Sell |
| 014One Year Average | Both Sides Result for 13 Signals |
Profit: $ 2.40 ($ 0.18 / Signal) |
All of Them | Buy + Sell |
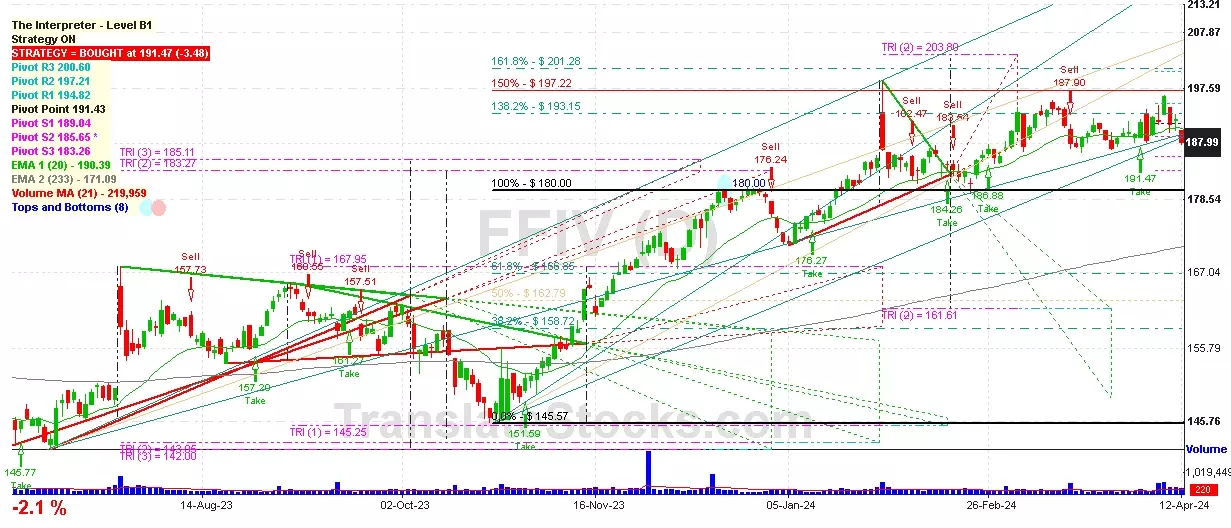
| Simple Moving Averages (SMA) Period | Value $ | Signal | Exponential Moving Averages (EMA) Period | Value $ | Signal | |
|---|---|---|---|---|---|---|
| 2 | 182.10 | SELL | 2 | 181.74 | BUY | |
| 3 | 181.48 | BUY | 3 | 181.47 | BUY | |
| 5 | 180.26 | BUY | 5 | 181.36 | BUY | |
| 8 | 180.66 | BUY | 8 | 181.99 | SELL | |
| 13 | 184.33 | SELL | 13 | 183.37 | SELL | |
| 21 | 186.58 | SELL | 21 | 184.91 | SELL | |
| 34 | 188.07 | SELL | 34 | 185.85 | SELL | |
| 55 | 187.34 | SELL | 55 | 185.27 | SELL | |
| 90 | 184.26 | SELL | 90 | 182.32 | SELL | |
| 200 | 170.25 | BUY | 200 | 173.31 | BUY |
F5 Inc
IPO: 1999-06-03
Ticker: FFIVIndices: S&P 500,
Exchange: Nasdaq Nms - Global Market (US - USD)
Website: https://www.f5.com/
Phone:
Common Stock
Technology (
Computer Communications Equipment
 Click to Enlarge