
| Date | Price $ | Result % | Candle Name | Side |
|---|---|---|---|---|
| 001 11 Apr 2024 | Buy Price: 1,507.56 | Loss: Close Day2 ($ 1,415.88) | Abandoned Baby | Buy |
| 002 14 Feb 2024 | Buy Price: 1,746.37 | Profit: Open Day1 ($ 1,760.00) | Abandoned Baby | Buy |
| 003 12 Feb 2024 | Sell Price: 1,733.23 | Profit: Open Day1 ($ 1,682.22) | Abandoned Baby | Sell |
| 004 01 Feb 2024 | Buy Price: 1,748.28 | Profit: Close Day1 ($ 1,772.90) | Abandoned Baby | Buy |
| 005 11 Jan 2024 | Sell Price: 1,591.68 | Loss: Close Day2 ($ 1,672.67) | Dark Cloud Cover | Sell |
| 006 04 Jan 2024 | Buy Price: 1,519.38 | Profit: Open Day1 ($ 1,527.08) | Engulfing | Buy |
| 007 23 Oct 2023 | Buy Price: 1,180.13 | Profit: Open Day1 ($ 1,183.84) | Piercing Line | Buy |
| 008 11 Oct 2023 | Sell Price: 1,243.95 | Profit: Open Day1 ($ 1,239.01) | Engulfing | Sell |
| 009 06 Oct 2023 | Buy Price: 1,237.53 | Profit: Close Day1 ($ 1,238.38) | Engulfing | Buy |
| 010 25 Sep 2023 | Buy Price: 1,290.53 | Loss: Close Day2 ($ 1,256.52) | Piercing Line | Buy |
| 011 24 Aug 2023 | Sell Price: 1,215.31 | Loss: Close Day2 ($ 1,249.46) | Engulfing | Sell |
| 012 03 Aug 2023 | Buy Price: 1,323.11 | Profit: Close Day2 ($ 1,358.81) | Abandoned Baby | Buy |
| 013 20 Jul 2023 | Sell Price: 1,198.34 | Loss: Close Day2 ($ 1,198.43) | Abandoned Baby | Sell |
| 014 17 Jul 2023 | Buy Price: 1,179.17 | Profit: Close Day1 ($ 1,208.66) | Engulfing | Buy |
| 015 14 Jul 2023 | Sell Price: 1,135.72 | Profit: Open Day1 ($ 1,128.30) | Abandoned Baby | Sell |
| 016 16 Jun 2023 | Sell Price: 1,194.74 | Profit: Open Day1 ($ 1,190.00) | Engulfing | Sell |
| 017 13 Jun 2023 | Sell Price: 1,209.52 | Profit: Open Day2 ($ 1,206.41) | Dark Cloud Cover | Sell |
| 018 12 May 2023 | Sell Price: 1,279.67 | Profit: Close Day2 ($ 1,275.39) | Abandoned Baby | Sell |
| 019 04 May 2023 | Sell Price: 1,213.38 | Loss: Close Day2 ($ 1,284.50) | Engulfing | Sell |
| 020 02 May 2023 | Sell Price: 1,255.74 | Profit: Close Day2 ($ 1,213.38) | Engulfing | Sell |
| 021One Year Average | Both Sides Result for 20 Signals |
Loss: $ -78.48 ($ -3.92 / Signal) |
All of Them | Buy + Sell |
| Simple Moving Averages (SMA) Period | Value $ | Signal | Exponential Moving Averages (EMA) Period | Value $ | Signal | |
|---|---|---|---|---|---|---|
| 2 | 1,366.92 | SELL | 2 | 1,367.63 | SELL | |
| 3 | 1,376.28 | SELL | 3 | 1,370.12 | SELL | |
| 5 | 1,370.70 | SELL | 5 | 1,375.39 | SELL | |
| 8 | 1,377.44 | SELL | 8 | 1,386.80 | SELL | |
| 13 | 1,412.31 | SELL | 13 | 1,407.67 | SELL | |
| 21 | 1,448.53 | SELL | 21 | 1,437.21 | SELL | |
| 34 | 1,482.60 | SELL | 34 | 1,475.04 | SELL | |
| 55 | 1,552.67 | SELL | 55 | 1,510.57 | SELL | |
| 90 | 1,590.93 | SELL | 90 | 1,522.14 | SELL | |
| 200 | 1,448.36 | SELL | 200 | 1,455.87 | SELL |
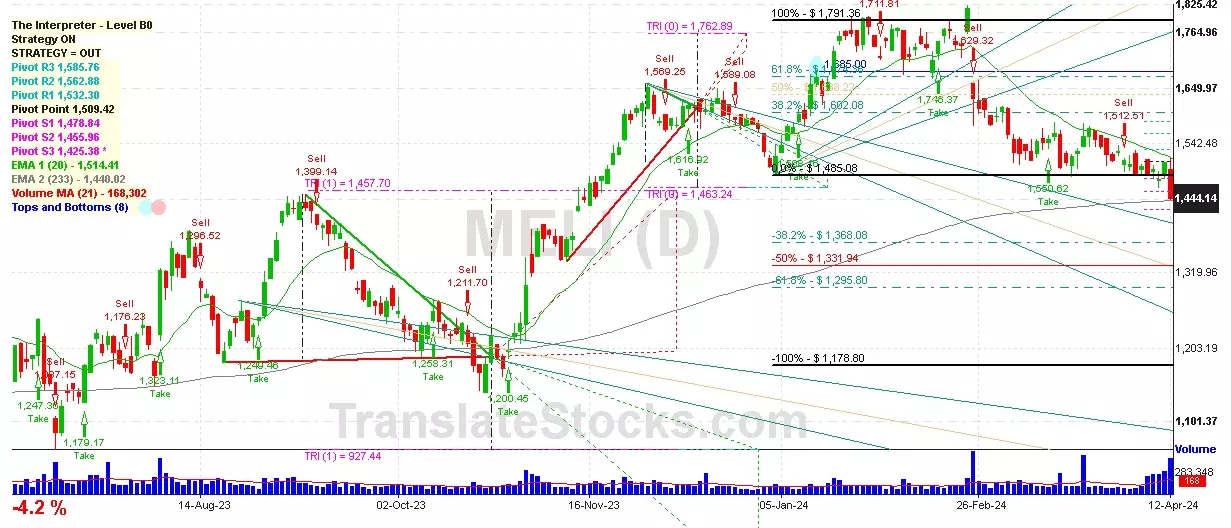
Mercadolibre Inc
IPO: 2007-08-10
Ticker: MELIIndices: Nasdaq 100,
Exchange: Nasdaq Nms - Global Market (AR - USD)
Website: http://www.mercadolibre.com
Phone:
Common Stock
Trade & Services (
Services-business Services, Nec

 Click to Enlarge