
| Date | Price $ | Result % | Candle Name | Side |
|---|---|---|---|---|
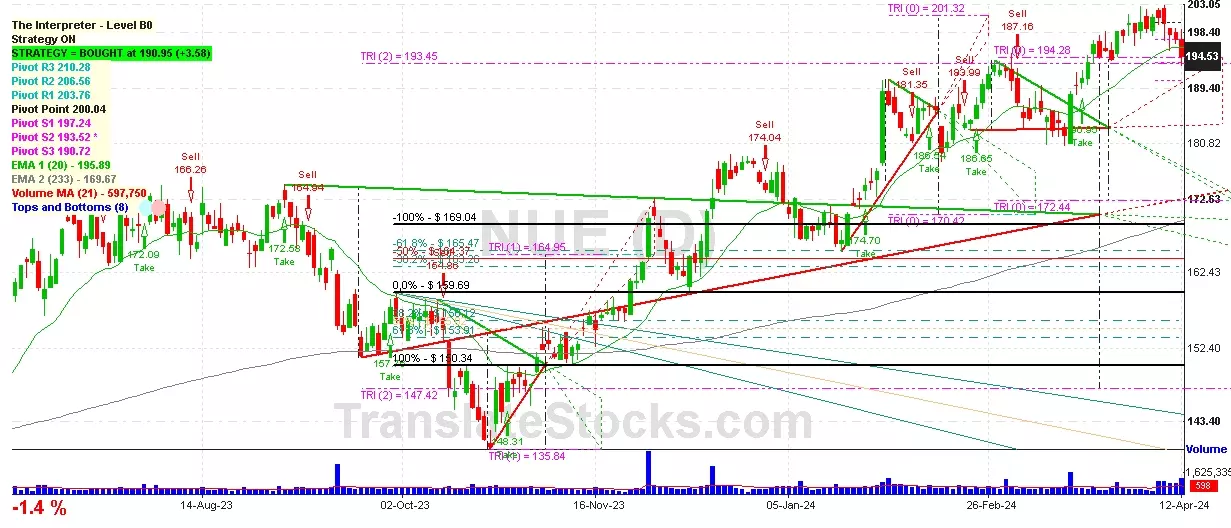
| 001 17 Apr 2024 | Buy Price: 192.78 | Profit: Open Day1 ($ 194.16) | Abandoned Baby | Buy |
| 002 22 Mar 2024 | Sell Price: 194.44 | Profit: Close Day2 ($ 194.06) | Engulfing | Sell |
| 003 02 Jan 2024 | Buy Price: 175.43 | Profit: Close Day1 ($ 176.57) | Engulfing | Buy |
| 004 09 Nov 2023 | Sell Price: 150.84 | Loss: Close Day2 ($ 152.94) | Engulfing | Sell |
| 005 09 Nov 2023 | Sell Price: 151.16 | Loss: Close Day2 ($ 152.94) | Dark Cloud Cover | Sell |
| 006 07 Nov 2023 | Sell Price: 151.44 | Profit: Open Day1 ($ 151.05) | Abandoned Baby | Sell |
| 007 05 Sep 2023 | Sell Price: 170.24 | Profit: Open Day1 ($ 169.94) | Abandoned Baby | Sell |
| 008 04 Aug 2023 | Sell Price: 167.76 | Profit: Open Day2 ($ 166.82) | Engulfing | Sell |
| 009 07 Jul 2023 | Buy Price: 161.95 | Profit: Close Day1 ($ 164.16) | Abandoned Baby | Buy |
| 010 21 Jun 2023 | Buy Price: 151.90 | Profit: Close Day1 ($ 153.33) | Engulfing | Buy |
| 011 12 May 2023 | Buy Price: 139.08 | Profit: Open Day1 ($ 140.16) | Abandoned Baby | Buy |
| 012One Year Average | Both Sides Result for 11 Signals |
Profit: $ 5.37 ($ 0.49 / Signal) |
All of Them | Buy + Sell |
| Simple Moving Averages (SMA) Period | Value $ | Signal | Exponential Moving Averages (EMA) Period | Value $ | Signal | |
|---|---|---|---|---|---|---|
| 2 | 174.32 | BUY | 2 | 175.68 | BUY | |
| 3 | 174.43 | BUY | 3 | 176.92 | SELL | |
| 5 | 181.25 | SELL | 5 | 179.84 | SELL | |
| 8 | 185.24 | SELL | 8 | 183.29 | SELL | |
| 13 | 189.68 | SELL | 13 | 186.79 | SELL | |
| 21 | 193.42 | SELL | 21 | 189.20 | SELL | |
| 34 | 191.90 | SELL | 34 | 189.77 | SELL | |
| 55 | 190.00 | SELL | 55 | 187.99 | SELL | |
| 90 | 184.16 | SELL | 90 | 183.74 | SELL | |
| 200 | 171.24 | BUY | 200 | 173.34 | BUY |
Nucor Corp
IPO: 1972-07-12
Ticker: NUEIndices: S&P 500,
Exchange: New York Stock Exchange, Inc. (US - USD)
Website: https://nucor.com/
Phone:
Common Stock
Manufacturing (
Steel Works, Blast Furnaces & Rolling Mills (coke Ovens)

 Click to Enlarge