| Date | Price $ | Result % | Candle Name | Side |
|---|---|---|---|---|
| 001 01 Apr 2024 | Sell Price: 172.98 | Profit: Open Day1 ($ 172.94) | Engulfing | Sell |
| 002 14 Mar 2024 | Sell Price: 164.78 | Profit: Close Day1 ($ 164.66) | Engulfing | Sell |
| 003 11 Oct 2023 | Sell Price: 162.62 | Profit: Open Day1 ($ 162.60) | Engulfing | Sell |
| 004 15 Sep 2023 | Sell Price: 179.84 | Profit: Close Day1 ($ 179.38) | Engulfing | Sell |
| 005 31 Aug 2023 | Sell Price: 177.92 | Profit: Close Day1 ($ 175.32) | Abandoned Baby | Sell |
| 006 27 Jul 2023 | Sell Price: 188.53 | Profit: Close Day2 ($ 187.46) | Engulfing | Sell |
| 007 11 Jul 2023 | Sell Price: 183.98 | Profit: Close Day1 ($ 183.17) | Engulfing | Sell |
| 008 28 Jun 2023 | Sell Price: 183.70 | Profit: Open Day1 ($ 183.25) | Engulfing | Sell |
| 009 27 Jun 2023 | Buy Price: 186.22 | Profit: Open Day1 ($ 186.25) | Engulfing | Buy |
| 010 02 Jun 2023 | Buy Price: 184.06 | Profit: Close Day1 ($ 184.19) | Engulfing | Buy |
| 011One Year Average | Both Sides Result for 10 Signals |
Profit: $ 5.73 ($ 0.57 / Signal) |
All of Them | Buy + Sell |
| Simple Moving Averages (SMA) Period | Value $ | Signal | Exponential Moving Averages (EMA) Period | Value $ | Signal | |
|---|---|---|---|---|---|---|
| 2 | 177.05 | SELL | 2 | 176.39 | BUY | |
| 3 | 175.10 | BUY | 3 | 175.89 | BUY | |
| 5 | 175.18 | BUY | 5 | 174.93 | BUY | |
| 8 | 173.14 | BUY | 8 | 173.81 | BUY | |
| 13 | 171.39 | BUY | 13 | 172.69 | BUY | |
| 21 | 171.39 | BUY | 21 | 171.71 | BUY | |
| 34 | 170.32 | BUY | 34 | 170.79 | BUY | |
| 55 | 169.22 | BUY | 55 | 170.02 | BUY | |
| 90 | 168.91 | BUY | 90 | 169.73 | BUY | |
| 200 | 171.50 | BUY | 200 | 171.25 | BUY |
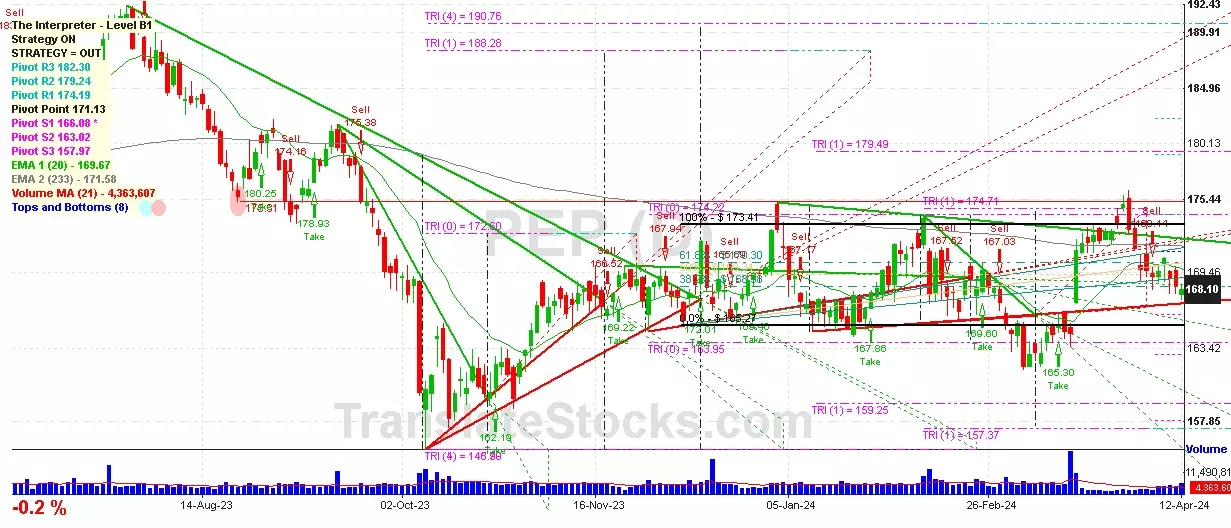
Pepsico Inc
IPO: 1919-12-18
Ticker: PEPIndices: S&P 500,
Nasdaq 100,
Exchange: Nasdaq Nms - Global Market (US - USD)
Website: https://www.pepsico.com/
Phone:
Common Stock
Manufacturing (
Beverages

 Click to Enlarge