
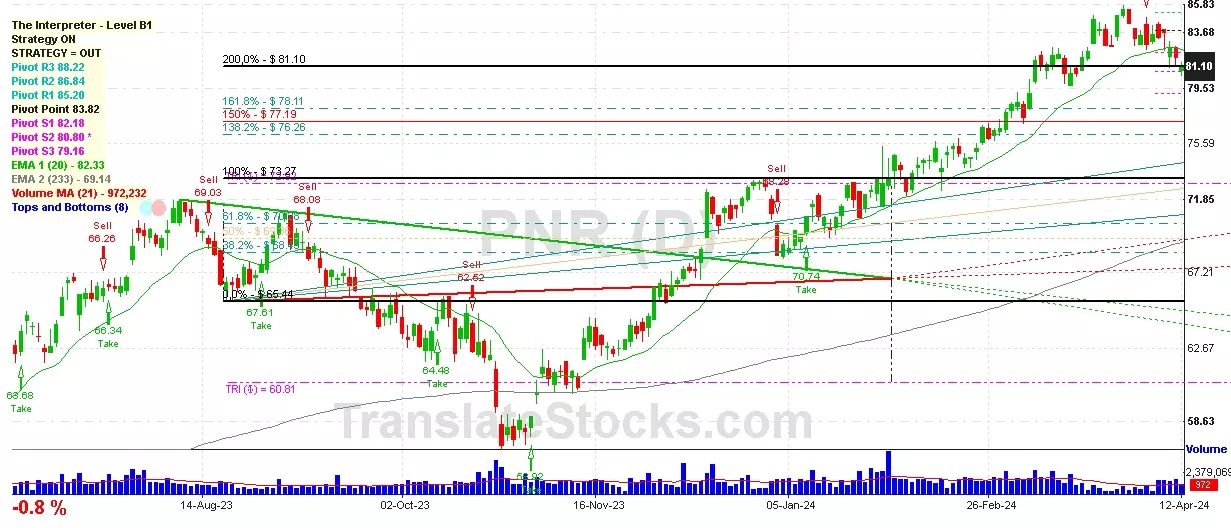
Hey Friend, I'm analysing PENTAIR PLC (PNR), and it is between the Support of $ 80.80 (PivotS2) and the Resistance of $ 81.10 (200% of Fibonacci). Since it is nailed exactly on the line of $ 81.10, we should wait for another day to better understand which side the stock will move to.

| Date | Price $ | Result % | Candle Name | Side |
|---|---|---|---|---|
| 001 01 Apr 2024 | Sell Price: 84.41 | Profit: Open Day1 ($ 84.00) | Engulfing | Sell |
| 002 20 Dec 2023 | Sell Price: 70.58 | Loss: Close Day2 ($ 71.89) | Engulfing | Sell |
| 003 20 Dec 2023 | Sell Price: 70.62 | Loss: Close Day2 ($ 71.89) | Dark Cloud Cover | Sell |
| 004 22 Nov 2023 | Buy Price: 62.72 | Profit: Close Day1 ($ 63.22) | Abandoned Baby | Buy |
| 005 20 Oct 2023 | Sell Price: 62.21 | Profit: Open Day1 ($ 62.06) | Engulfing | Sell |
| 006 04 Oct 2023 | Buy Price: 64.06 | Loss: Close Day2 ($ 63.30) | Abandoned Baby | Buy |
| 007 25 Sep 2023 | Buy Price: 65.61 | Loss: Close Day2 ($ 64.72) | Engulfing | Buy |
| 008 03 Aug 2023 | Buy Price: 69.47 | Profit: Open Day1 ($ 69.72) | Engulfing | Buy |
| 009 03 Aug 2023 | Buy Price: 69.35 | Profit: Open Day1 ($ 69.72) | Piercing Line | Buy |
| 010 01 Aug 2023 | Buy Price: 69.90 | Loss: Close Day2 ($ 69.35) | Engulfing | Buy |
| 011 22 Jun 2023 | Sell Price: 60.23 | Profit: Open Day1 ($ 59.78) | Engulfing | Sell |
| 012 30 May 2023 | Sell Price: 57.18 | Profit: Open Day1 ($ 56.79) | Engulfing | Sell |
| 013 01 May 2023 | Sell Price: 57.61 | Loss: Close Day2 ($ 57.66) | Engulfing | Sell |
| 014One Year Average | Both Sides Result for 13 Signals |
Loss: $ -2.31 ($ -0.18 / Signal) |
All of Them | Buy + Sell |
| Simple Moving Averages (SMA) Period | Value $ | Signal | Exponential Moving Averages (EMA) Period | Value $ | Signal | |
|---|---|---|---|---|---|---|
| 2 | 79.10 | BUY | 2 | 79.09 | BUY | |
| 3 | 78.89 | BUY | 3 | 79.03 | BUY | |
| 5 | 78.88 | BUY | 5 | 79.08 | BUY | |
| 8 | 79.01 | BUY | 8 | 79.38 | SELL | |
| 13 | 80.11 | SELL | 13 | 79.95 | SELL | |
| 21 | 81.56 | SELL | 21 | 80.43 | SELL | |
| 34 | 81.74 | SELL | 34 | 80.26 | SELL | |
| 55 | 79.63 | SELL | 55 | 79.04 | BUY | |
| 90 | 76.48 | BUY | 90 | 76.69 | BUY | |
| 200 | 70.44 | BUY | 200 | 71.04 | BUY |
Pentair Plc
IPO: 2012-09-17
Ticker: PNRIndices: S&P 500,
Exchange: New York Stock Exchange, Inc. (GB - USD)
Website: https://www.pentair.com/
Phone:
Common Stock
Technology (
Special Industry Machinery (no Metalworking Machinery)
 Click to Enlarge